AHP as a Decision Making Tool in Projects, Programs and Portfolios
Developed by Christian Vindegaard Grønberg
Analytical hierarchy process, AHP, is one of many multi-criteria decision making tool. It can be used both project, program and portfolio management as many decisions has to be made. AHP is a structured way of organizing complex decision. It’s based on math and psychology and it uses a scoring system. AHP differentiates from other multi-criteria decision making tools by rating the scores to make sure that no biased decision can be made. To use AHP the decision has to be formulated into a hierarchy with a goal, certain criteria and some alternatives to choose from. A hierarchy is the basic human way of dealing with decisions which makes the model highly intuitive, even when complex decisions has to be made.
For a project, program or portfolio manager who has to make many decisions AHP can be a help for standardizing and automating many of these decisions by providing the same framework for every decision made. This also goes for larger project organizations, where the tools can be used as a way of directing all the decisions made within the organization.
In this article the reader will first be introduced to the history of AHP. After this the relevance of the tool in project, program and portfolio management will be shortly discussed. Then the application of the tool will be introduced to the reader in a step by step manner with an example. Lastly a few examples of the use of AHP in project management and an annotated library will be presented.
Contents |
History
While directing research projects for United States Arms Control and Disarmament Agency in 1960’s Thomas L. Saaty worked with some of the world leading lawyers, economists and game theorists advising on which weapon to procure, keep and scrap. Even though working with some of the world leading academics Thomas L. Saaty wasn’t satisfied with the results gained throughout the different projects. He found that the models where to abstract to give a particular answer. They also had problems addressing the diverse concerns of the scientists.
Years later Thomas L. Saaty was still trouble by these issues. In an article from 1986 [1] he came up with the axioms for the AHP as a solution to his problem. AHP is a mathematical well-defined structure consisting of matrices and their associated right-eigenvector’s ability to generate true or approximate weights. The methodology compares criteria, or alternatives in a pairwise mode with the use of a fundamental scale.
Relevance for Project, Program and Portfolio Management
Both in projects, programs and portfolios decisions has to made on a daily basis. These decisions are often multi criteria decisions, which has to be made on an objective manor. AHP is ideal for this by its structure, simplicity and ease of use. What makes AHP even more relevant how it eliminates subjective and biased input with the eigenvectors.
The Analytic Hierarchy Process
The AHP methodology is based on three primary functions: Structuring complexity, measurements and synthesis. The basic human way of structuring complexity is by hierarchy, so to make the methodology simple this is how problems are structured. Hierarchical-based methodology has to use ratio-scale priorities for measurements. The reason for this is that the priority of an element at any level of the hierarchy is determined by multiplying the priorities of the elements in that level by the priorities of the parent element[2]. When a multi criteria decision is made it often synthesizes over more dimensions than what the human intuition can handle. Therefor the last function of the AHP methodology is to synthesizes all the dimensions of the decision.
According to DSS Resources these three primary functions leads to the following definition:
From this definition 6 steps can be derived for the AHP methodology:
- Define objective
- Structure the multiple choice criteria into a hierarchy
- Make a pair wise comparison of elements in each group
- Socring and consistency ratio
- Evaluate alternatives according to weighting
- Get ranking
Application
To apply the AHP methodology the 6 steps has to be used in order. The first times AHP is used it will take a lot of time, but when it has been used several times it’s really easy to apply and use.
Step 1: Define objective
Here the goal for the multi criteria decision should be set. An example of an objective for a project could be the selection of a new computer supplier for a company.
Step 2: Hierarchy
The simplest way of structuring a decision problem is by a hierarchy. The goal of the decision being the top level. The criteria of the decision being the second. The third level are the different alternatives. This way of structuring the decision problem is illustrated in figure 1[3], where the example with the selection of a new computer supplier is continued:

The goal is what you want to obtain from the decision, in the example it would be to choose a new computer supplier. Then the criteria are the different requirements you have to fulfill to obtain the goal, in the example it would be the demands you have to the given supplierlike battery time, processing power and durability. The alternatives would then be the different options to choose between, in the example it is the suppliers Lenovo, HP and Apple.
Step 3: Pair wise comparison
For the pair wise comparison of the scoring system the fundamental scale is used. This scale rank the criteria’s level of importance compared to the other criteria on a scale from 1-9. Where 1 is equally importance and 9 is that the criteria looked at is extremely important. The scale is given below [3]:
| Fundamental scale | ||
|---|---|---|
| Intensity of importance | Definition | Explanation |
| 1 | Equal importance | Two activities contribute equally to the objective |
| 2 | Weak | |
| 3 | Moderate importance | Experience and judgment slightly favor one activity over another |
| 4 | Moderate plus | |
| 5 | Strong importance | Experience and judgment strongly favor one activity over another |
| 6 | Strong plus | |
| 7 | Very strong or demonstrated importance | An activity is favored very strongly over another, its dominance demonstrated in practice |
| 8 | Very, very strong | |
| 9 | Extreme importance | The evidence favoring one activity over another is of the highest possible order of affirmation |
| Reciprocals of above | If activity i has one of the above nonzero numbers assigned to it when compared with activity j, then j has the reciprocal value when compared with i | A reasonable assumption |
| Rationals | Ratios arising from the scale | If consistency were to be forced by obtaining n numerical values to span the matrix |
| Table 1: Fundamental scale. This scale rank the criteria’s level of importance compared to the other criteria on a scale from 1-9. Where 1 is equally importance and 9 is that the criteria considered extremely important | ||
The pairwise comparison is done for two things:
- Alternatives with respects to criteria
- Criteria with respect to the goal
The alternatives scored with respect to criteria gives on matrix for each criteria. The matrix for criteria battery time for the computer provided by the supplier could look like this:
| Pairwise comparison of computers with regards to battery time | |||||
|---|---|---|---|---|---|
| Lenovo | HP | Mac | |||
| Lenovo | 1 | 5 | 3 | ||
| HP | 1/5 | 1 | 1/2 | ||
| Mac | 1/3 | 2 | 1 | ||
| Sum | 1.53 | 8 | 4.5 | ||
| Table 2: The alternatives are compared with each other using the fundamental scale from table 1 | |||||
The same process is then done for the processing power and durability.
The comparison of the criteria with respect to the goal only need to be done once. The comparison only makes sense if the criteria has different weights. For the decision of a new computer supplier the criteria could be ranked liked this:
| Pairwise comparison of the criteria | |||||
|---|---|---|---|---|---|
| Battery time | Processing power | Durability | |||
| Battery time | 1 | 5 | 7 | ||
| Processing power | 1/5 | 1 | 3 | ||
| Durability | 1/7 | 1/3 | 1 | ||
| Sum | 13 | 4.2 | 1.48 | ||
| Table 3: The criteria are compared with each other using the fundamental scale from table 1 | |||||
Step 4: Scoring and consistency
To calculate the consistency, the average random consistency index is used. But before this is done, the matrix has to be normalized and the eigenvector has to be found. The vector is normalized by dividing each cell in the column with the total sum of the column. For the Lenovo computer in the former example the calculations will look like this:
| Normalization for the Lenovo | |||
|---|---|---|---|
| Lenovo | 1/1.53 | 5/8 | 3/4.5 |
| Table 4: The score for the Lenovo batteri time are normalized by dividing the score against each alternative with the sum of the total score in the given column | |||
By doing the calculations for all of the alternatives we end up with the following normalized matrix. Added to this matrix is the sum of the rows divided by the number of alternatives which gives us their priority:
| Normalized pairwise comparison of computers with regards to battery time | |||||
|---|---|---|---|---|---|
| Lenovo | HP | Mac | Priority | ||
| Lenovo | 0.65 | 0.63 | 0.67 | 0.65 | |
| HP | 0.13 | 0.13 | 0.11 | 0.12 | |
| Mac | 0.22 | 0.25 | 0.22 | 0.23 | |
| Table 5: Here all the alternatives are normalized in the same manor as in table 4 and the rows are summed into the priority | |||||
Now the principal eigen vector is found as the matrix product of the sums from table 2 and the priorities from table 5. In the case for pairwise comparison of alternatives battery time the principal eigen vector is 3. The pricipal eigen vector is used to find the inconsistency which is given by:
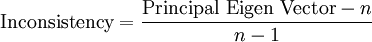
|
Equation 1 |
Where n is the number of alternatives. The inconsistency is used combined with random consistency index (RI)[4], table 6, to make the inconsistency ratio, equation 2:
| Random consistency index | ||||||||||
|---|---|---|---|---|---|---|---|---|---|---|
| Size of matrix | 1 | 2 | 3 | 4 | 5 | 6 | 7 | 8 | 9 | 10 |
| Random consistency index | 0 | 0 | 0.58 | 0.90 | 1.12 | 1.24 | 1.32 | 1.41 | 1.45 | 1.49 |
| Table 6: The random consistency index is used togther with the inconsistency to find the consistency ratio for the matrix | ||||||||||
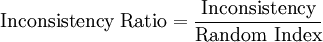
|
Equation 2 |
The inconsistency ratio is what different AHP from other decision making tools. Here the subjectiveness of the rating will be presented. So if a decision maker rates one alternative consequently higher than the other alternatives, but do not do this in way which is consistent, this will be shown in a high inconsistency ratio. Normally a inconsistency ratio below 10% is given as an objective ratio. The inconsistency ratio for the battery lifetime is:

|
Equation 3 |
This is 5% and therefor within the 10% limit.
Now the process from step 3, table 2, and step 4, table 4 and 5, and equation 1, 2, and 3 has to be carryout for the two other criteria, processing power and durability, and for the pairwise comparison of the criteria in table 3.
Step 5: Evaluation of the alternatives
Here all the calculations are combined. This combination is the product of the priorities of the alternatives with respect to the criteria, calculated in table 5, multiplied with the priority of the criteria towards the goal. This is done for the example:
| Criterion | Alternative | Priority vs Criteria | Priority vs Goal | Combined Priority | ||||||
|---|---|---|---|---|---|---|---|---|---|---|
| Battery time | Lenovo HP Apple |
0.65 0.12 0.23 |
x 0.72 x 0.72 x 0.72 |
= 0.47 = 0.09 = 0.17 | ||||||
| Processing power | Lenovo HP Apple |
0.63 0.26 0.11 |
x 0.19 x 0.19 x 0.19 |
= 0.12 = 0.05 = 0.02 | ||||||
| Durability | Lenovo HP Apple |
0.26 0.11 0.63 |
x 0.08 x 0.08 x 0.08 |
= 0.02 = 0.01 = 0.05 | ||||||
| Table 7: Here the combined priority is calculated as a product of the priority with respect to criteria and goals | ||||||||||
Step 6: Make the decision
Now the only thing left is to make the decision. To derive the best alternative from the AHP the data combined in table 7 are summed:
| Alternative | Battery time | Processing power | Durability | Score | ||||||
|---|---|---|---|---|---|---|---|---|---|---|
| Lenovo | 0.47 | 0.12 | 0.02 | 0.61 | ||||||
| HP | 0.08 | 0.05 | 0.01 | 0.15 | ||||||
| Apple | 0.17 | 0.02 | 0.05 | 0.24 | ||||||
| Table 8: The final score is calculated as the sum of the priorities from table 7 | ||||||||||
Now based on the AHP the right choice would be to go with Lenovo with a score of 0.61.
Examples on the use of AHP
AHP can be used for choices as just seen in the example, these choices have to made in both project, programs and portfolios. A company using AHP for portfolio management is Xerox Corporation, but they also uses it within technology implementation and engineering design selection. NASA used AHP in the project group who had to decide on the which power source to use for the first lunar outpost with criteria such as Safety, Performance, Reliability and Flexibility. AHP can also be used for prioritization and evaluation. Here an example could be General Motors who use it prioritize between different programs leads to the most cost-effective automile designs. [5]
Annotated bibliography
References used in the article
- Saaty, T. L. (1986). Axiomatic Foundation of the Analytic Hierarchy Process. Management Science, 32(7) [1]
- This article is the foundation of analytical hierarchy process. Here the basic axioms for the method is presented
- Forman, E. H. (2001). The Analytic Hierarchy Process: An Exposition. Operations Research, 49(4) [2]
- This book is a very descriptive book about the history and use of AHP. It is well suited for beginners
- Saaty, T. L., & Vargas, L. G. (2012). Models, Methods, Concepts & Applications of the Analytic Hierarchy Process (Vol. 175). Boston, MA: Springer US. [3]
- This book is written by the inventor of the AHP model as a summary of all the newest research with regards to the Analytic Hierarchy Process
- Saaty, T. L., & Vargas, L. G. (1984). Comparison of eigenvalue, logarithmic least squares and least squares methods in estimating ratios. Mathematical Modelling, 5(5), 309–324. [4]
- In this article the random consistency index is described and derived mathematically
- Forman, E. H. (2001). The Analytic Hierarchy Process: An Exposition. Operations Research, 49(4). http://doi.org/10.2307/3088581
- This articles presents a good overview of the applications of AHP divided into: Choices, Prioritization/Evaluation, Resource Allocation, Benchmarking, Quality Management, Public Policy and Health Care
Video
A short video introducing the use of AHP by an example can be found here:
References
- ↑ 1.0 1.1 Saaty, T. L. (1986). Axiomatic Foundation of the Analytic Hierarchy Process. Management Science, 32(7). http://doi.org/10.2307/2631765
- ↑ 2.0 2.1 Forman, E. H. (2001). The Analytic Hierarchy Process: An Exposition. Operations Research, 49(4). http://doi.org/10.2307/3088581
- ↑ 3.0 3.1 3.2 Saaty, T. L., & Vargas, L. G. (2012). Models, Methods, Concepts & Applications of the Analytic Hierarchy Process (Vol. 175). Boston, MA: Springer US. http://doi.org/10.1007/978-1-4614-3597-6
- ↑ 4.0 4.1 Saaty, T. L., & Vargas, L. G. (1984). Comparison of eigenvalue, logarithmic least squares and least squares methods in estimating ratios. Mathematical Modelling, 5(5), 309–324. http://doi.o
- ↑ Forman, E. H. (2001). The Analytic Hierarchy Process: An Exposition. Operations Research, 49(4). http://doi.org/10.2307/3088581
Calculations
All the calculations done for the example can be found at the link below. This spreadsheet can also be used as template for future work. To be sure that all functions are working probably it is recommended to download the file before working in it.
https://drive.google.com/open?id=0B7Yjzzma6ipUSDJfdkJFMnp0WkE