Benefit Cost Ratio (BCR)
(→Project appraisal steps) |
(→Project appraisal steps) |
||
| Line 36: | Line 36: | ||
===Project appraisal steps=== | ===Project appraisal steps=== | ||
| − | A Typical CBA is structured in seven steps: | + | A Typical CBA is structured in seven steps:<ref name="Gerald"/> |
1. '''Description of the context''': The problem or opportunity, such as a proposed investment, policy change, or project that the CBA is trying to solve must be identified in this step. It also includes identifying the relevant stakeholders. | 1. '''Description of the context''': The problem or opportunity, such as a proposed investment, policy change, or project that the CBA is trying to solve must be identified in this step. It also includes identifying the relevant stakeholders. | ||
Revision as of 19:56, 26 April 2023
Contents |
Abstract
This article discusses the application of the Benefit Cost Ratio (BCR) method in the Cost Benefit Analysis. The Benefit Cost Ratio is a profitability indicator, and it is the ratio of the present value of the benefit of the project to the present value of the cost. It is usually used to summarize the results of the cost benefit analysis (CBA) during the financial appraisal of a proposed program, project or portfolio. [1] BCR indicates if the project is feasible or not, meaning the higher the BCR, the more attractive the risk-return profile of the project/asset. If the BCR value of a project is less than 1, the project's costs outweigh the benefits, and it should not be considered viable. Calculating the BCR of an asset or project is comparatively simple. In addition, the ratio considers the discount rate, hence the time value of the money.[2]. Despite the fact that BCR is a tool to show the attractiveness of a project or an asset, cannot simply be the only determinant of a project's feasibility.
Initially, this article discusses the origin of the Cost Benefit Analysis and BCR. Then, it focuses on the formula for the calculation of the Benefit Cost Ratio and how it considers the time value of the money. Next, there is a comparison between BCR and other CBA methods. After that, the article introduces other formulas and applications of the BCR. Finally, it discusses the advantages and the limitations of the Benefit Cost Ratio.
Cost Benefit Analysis
Cost-benefit analysis (CBA) is a method of economic assessment that seeks to quantify the positive and negative impacts of a proposed decision or project. The technique has been used for centuries, with the earliest known examples dating back to the 1700s. However, the use of CBA were mandatory only after regulations were established by the US government in the 1930s CBA is often used to determine whether or not a proposed decision or project is worth investing in. It is also used to compare different options or to determine which option will provide the greatest benefit to its stakeholders.[3] One of the earliest applications of cost-benefit analysis was in the transportation sector, where it was used to evaluate the feasibility and desirability of public infrastructure projects.[4]
In the 1960s, there were economists such as Kenneth Arrow, Milton Friedman, and Richard Musgrave, who supported that CBA could be an important method for evaluating the efficiency of government programs.[5]
After that, CBA was refined over the next decades due the advent of computers and still more sophisticated prediction modelsand is widely used in a variety of fields, including environmental regulation, health care, and transportation planning.[6]
The last years the goal is to link CBA with other methods (hard and soft operation research techniques) and setting a focus on wider impacts, stakeholders and robustness. It is widely accepted that the use of only cost-benefit analysis (CBA) may not be sufficient to fully evaluate the complex social, economic, and environmental impacts of a particular decision or policy. As a result, there has been increasing interest in integrating CBA with other methods, such as hard and soft operations research techniques, as well as other forms of economic analysis. Moreover, there has been a focus on broader impacts beyond just the monetary costs and benefits, such as social and environmental impacts, and taking into account the perspectives of various stakeholders. This is often referred to as a "multi-criteria decision analysis" approach. [7]
CBA is based on a set of predetermined project objectives and assigns a monetary value to all the welfare impacts of the intervention, both positive (benefits) and negative (costs). To get the net total benefit, these numbers are totaled after being discounted. The Economic Net Present Value (ENPV), which is expressed in monetary values, and the Economic Rate of Return (ERR), which enables comparison and ranking for competing projects or alternatives, are the indicators used to gauge the overall success of the project. There are two approaches for CBA. [4]
Microeconomic approach
CBA is often a microeconomic approach that enables the calculation of economic performance indicators, offering an assessment of predicted welfare improvements, to analyze the project's influence on society as a whole. While the project's direct employment or external environmental consequences are recognized in the ENPV, indirect and broader effects (such as those on secondary markets, public funds, employment, regional growth, etc.) should be disregarded. This is because of two key factors:
1. The majority of indirect and/or wider effects are typically capitalized, redistributed, and altered versions of direct effects. This has as a result for benefits to be double-counted.
2. There is still a little experience with how to translate indirect effects into reliable project appraisal techniques.
Incremental approach
CBA compares a scenario with-the-project with a counterfactual baseline scenario without-the-project. A counterfactual scenario is what would occur if the project hadn't been started. All cash flows connected to project-area operations are projected for each year of the project's lifespan in this scenario. In cases where a project consists of a completely new asset, e.g. there is no pre-existing service or infrastructure, the without-the-project scenario is one with no operations. When making improvements to an existing facility, costs and revenues/benefits for maintaining the service at a level that it can still be used, or even minor adaptations that were planned to happen anyway, should be considered.
For this approach the CBA only considers the difference between the cash flows in the with-the-project and the counterfactual scenarios. The financial and economic performance indicators are calculated on the incremental cash flows only.
Project appraisal steps
A Typical CBA is structured in seven steps:[1]
1. Description of the context: The problem or opportunity, such as a proposed investment, policy change, or project that the CBA is trying to solve must be identified in this step. It also includes identifying the relevant stakeholders.
2. Identification of alternatives: This step involves identifying and evaluating different alternatives and options. Also, in this step the baseline scenario is defined, which the alternatives will be compared.
3. Development of criteria: In this step, different criteria or indicators are identified, which will be used to evaluate the alternatives.
4. Analysis of impacts: After identifying the criteria, the next step is to define the impacts of each alternative. Also, in this step the benefits and costs of each alternative are calculated.
5. Comparison of alternatives: In this step, the alternatives are compared against the criteria developed in step 3. The comparison can be done using different techniques, such as cost-effectiveness analysis, multi-criteria analysis, or a combination of these.
6. Sensitivity analysis: In this step, the impact of different assumptions is assessed, finding the most critical assumptions and uncertainties.
7. Conclusions and recommendations: In the final step, the results of the analysis are summarized, and conclusions are drawn.
What is BCR?
The Benefit Cost Ratio is a profitability indicator, and it is the ratio of the present value of the benefit of the project to the present value of the cost. It is usually used to summarize the results of the cost benefit analysis (CBA) during the financial analysis of a proposed program, project or portfolio.[1] The origins of BCR can be traced back to the early 20th century when economists and engineers first began developing methods to evaluate the costs and benefits of public infrastructure projects. One of the earliest known applications of BCR was in the United States in the 1920s, when the Bureau of Public Roads began to use it to evaluate the economic benefits of road construction projects. BCR began to be used as more in the 1930s and 1940s, when economists and engineers needed to refine and standardize methods for estimating costs and benefits.
Today, the BCR is widely used by the public and private sectors to assess the economic viability of various projects and investments, such as transportation infrastructure, power generation facilities and public health initiatives.
BCR is another way of comparing the present value of a project’s costs with the present value of its benefits. If the value of BCR of a project is greater than 1.0, the project is expected to have also a positive NPV and to have an internal rate of return (IRR) higher than the discount rate used in the calculations. When the BCR has a value equal to 1.0, indicates that the NPV of expected profits equals the costs. If BCR of a project is less than 1.0, the project's costs outweigh the benefits, and it should not be feasible. [8]
In the last case, the project does require financial support. For that reason the economic analysis is mandatory to examine if the society is better off with or without the project. To achieve that, there is a evaluation of non-markets impacts and fiscal corrections.
Time value of money
Benefits and costs have a higher value today than tomorrow. The time value of money is a basic financial concept used to calculate the present value of an amount of money today compared to its future value. This concept is based on the idea that money has a time value because it can earn interest over time. In other words, a dollar received today is worth more than a dollar received in the future due to the potential to earn additional. [2]
There is a need for discounting when comparing any flow of funds (costs and revenues or benefits) over time. To consider the process of discounting in practice, consider two investment projects, A and B. The net cash flows of these projects are given as:

The values of each year need to be discounted to calculate the present value, and there is an example for these calculations making the usual assumption that the discount rate is constant from year to year.

Discount Factors for 10% and 15% Discount Rates

Discount Rate
The rate at which a society is ready to exchange present consumption for future consumption is measured by the social discount rate. The discount rate is the rate of interest used to calculate the present value of future cash flows in economic appraisals. It is used to discount the expected future cash flows to their present value. The discount rate used in economic appraisals is usually determined by the current level of interest rates. Discounting is used when monetary values are distributed in time and these values should be added together in a specific year. A simple way of understanding discounting is to see it as a weight with this weight (1+i)^t determined as a function of t and the discount rate is i, as it can be seen below: [4]

A project with a cost of 1€ and with discount rate equal to 2%, has to produce benefits of 2.7€ in 50 years would be socially acceptable. However, in the case the discount rate was 5% the break-even benefit would be approximately 11.5€. For that reason, the social planners using a high discount rate tend to favor projects with benefits, which are producing benefits in a short period of time. In practice, there are two types of discount rate, the social opportunity cost and social time preference.[9]
How to Calculate BCR?
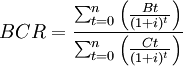
Where:
t: The calculation period in years
Bt: Benefits in year t
Ct: Costs in year t
i: The discount rate
Examples
Example 1
In this section, there will be an example of how BCR can be calculated in a scenario. A company decides to lease the equipment needed for a project for $50,000 rather than purchasing it. The discount rate is 2%, and the renovations are expected to increase the company's annual profit by $100,000 for the next three years.[8]
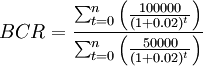

In this example, the BCR of the project is 5.77, which indicates that the project is feasible. Moreover, the company could expect $5.77 in benefits for each $1 of costs.
Example 2
The government is considering building a new highway, and they want to calculate the Benefit-Cost Ratio (BCR) of the project. They estimate that the construction cost will be $100 million and the highway will generate 30 million in benefits for each year over the next 4 years. The discount Ratio is 3%.


This means that for every dollar spent on the project, there will be $1.1178 in benefits over the next 4 years. A BCR of greater than 1 indicates that the project is economically viable.
Comparison Between BCR and NPV
BCR and NPV are two different methods of financial appraisal. BCR measures the ratio of benefits to costs, while NPV measures the present value of future cash flows. Both methods measure the profitability of an investment with different methods. BCR focuses on determining ROI, while NPV takes into account the present value of future cash flows.[10]
Comparing or ranking two or more projects, again assuming no budget constraint, the BCR decision-rule can give incorrect results. For example, comparing two different projects A and B , where:

For the projects A and B, the BCR value is 1.67 and 1.78, respectively. However, using the NPV decision-rule would place A (NPV=40) above B (NPV=35). In this situation the NPV decision-rule would be the correct one to consider for ranking purposes, unless there is a budget constraint.[10]
Other formulas of CBA
1. Payback Period = Initial Investment / Annual Cash Inflow
The payback period is the length of time it takes for the initial investment to be recovered through the annual cash inflows generated by the investment. For example, if an investment requires an initial outlay of $10,000 and generates annual cash inflows of $2,000, the payback period would be:

2. Return on Investment = Annual Net Income / Initial Investment
It is a financial metric used to measure the profitability of an investment. An investment cost is $10,000 in a stock and it is sold it for $12,000, the profit would be $2,000. The total cost of investment including fees and taxes was $11,000, ROI would be:

3. Net Present Value = Net Present Value / Initial Investment
It is a financial metric used to calculate the present value of future cash flows generated by an investment, taking into account the time value of money. It is a common indicator for the profit�ability of a project or investment proposal. If the value of NPV is positive, it shows that the investment is feasible and is expected to generate a positive return. If the NPV is negative, it means that the investment is expected to generate a negative return.
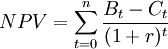
Where:
B: is the cash inflow in period t
C: is the cash outflow (cost) in period t
r: is the discount rate
n: is the last period of the project
4. Internal Rate of Return = Internal Rate of Return / Discount Rate
IRR is a profitability metric and is defined as the discount rate that makes the net present value (NPV) from a particular project to be zero. The IRR of each project must be higher than the discount rate and the project with higher IRR value, are more preferable The IRR of each project must be higher than the discount rate and the project with higher IRR value, are more preferable.
5. Profitability Index = Present Value of Future Cash Flows / Initial Investment
The profitability index (PI), alternatively referred to as value investment ratio (VIR) or profit investment ratio (PIR), describes an index that represents the relationship between the costs and benefits of a proposed project.[8]
Advantages of BCR
1. The BCR translates the absolute amounts of benefits and costs into a ratio and allows a direct comparison of the benefits and costs of a project. It is financial metric that compares the total present value of benefits to the total present value of costs for a project.
2. The BCR is a relatively simple method and a good starting point for the financial analysis to determine if a project is feasible or not.
3. For the calculation of BCR the time value of money through the discount rate is considered. By taking into account the fact that money in the future has less value than money today, as a result this provide a more accurate assessment of the project's profitability.[11]
Limitations of BCR
1. The main limitation of the BCR is that it reduces a project to a simple number when the feasibility of an investment or a project relies on many factors and can be undermined by unforeseen events.
2. The calculation of BCR of a project depends in many assumptions. For example, an incorrect discount rate would lead to a flawed ratio.
3. The project's potential externalities or spillover effects are not taken into account by the BCR technique. The BCR result, for instance, may not account for unanticipated negative effects a project may have on the environment or nearby communities.
4. The BCR is commonly used in conjunction with other financial metrics, in order to format a well-informed decisions about project feasibility.[11]
5. This method relies heavily an accurate forecasting of future costs and benefits, which can be difficult to predict with certainty. This may result in overly optimistic benefits estimates or underestimated costs, which may compromise the reliability of the BCR result.
References
- ↑ 1.0 1.1 1.2 Shively G., An Overview of Benefit-Cost Analysis., (Gerald Shively, Purdue University, 2012),
- ↑ 2.0 2.1 CFI Team., Benefit-Cost Ratio (BCR), https://corporatefinanceinstitute.com/resources/accounting/benefit-cost-ratio-bcr
- ↑ E.J. Mishan ., Cost-Benefit Analysis., (E.J. Mishan, Euston Quah , 2020),
- ↑ 4.0 4.1 4.2 European Commission , Guide to Cost-Benefit Analysis of Investment Projects, (2014), https://wayback.archive-it.org/12090/20221203224508/https://ec.europa.eu/inea/sites/default/files/cba_guide_cohesion_policy.pdf
- ↑ Kenneth Arrow , Social Choice and Individual Values, (1951),
- ↑ Richard L. Schmalensee and Robert N. Stavins , The Use of Benefit-Cost Analysis in Environmental, Health, and Safety Regulation, (2013),
- ↑ Häcker J. and Ernst D., Ch. 8 - Investment Appraisal. In: Financial Modeling. Global Financial Markets, (Palgrave Macmillan, London, 2017), pp. 343-384, https://doi.org/10.1057/978-1-137-42658-1_8
- ↑ 8.0 8.1 8.2 investopedia , Profitability Index (PI): Definition, Components, and Formula, https://www.investopedia.com/terms/p/profitability.asp
- ↑ H. Lopez ., The Social Discount Rate: Estimates for Nine Latin American Countries, (H. Lopez , 2012),
- ↑ 10.0 10.1 Harry F. Campbell and Richard P. C. Brown , Benefit-Cost Analysis: Financial and Economic Appraisal using Spreadsheets, (2003),
- ↑ 11.0 11.1 Dupuis Xavier , Applications and limitations of cost-benefit analysis as applied to cultural development, (1985), https://unesdoc.unesco.org/ark:/48223/pf0000081977