Risk quantification is a 2nd step of project risk management, after risk identification and before risk response development and risk response control. Risk quantification is a process to evaluate identified risks to produce data that can be used in deciding a response to corresponding risks. The objective of project risk quantification is to prepare contingencies in terms of costs, time, or human resources and prioritize them. Risks are quantified by using likelihood or probability of an event to occur i.e. probability of failure on demand (PFD) and its impact or severity on the outcome or situation. Risks then can be categorised into acceptable or not acceptable risks and further actions are taken accordingly. Stakeholder risk tolerance, potential risk events, sources of risks, and estimates of costs and times are some of the inputs to risk quantification process. Whereas, opportunities and threats are the outputs of risk quantification process. Poor risk management may lead to project failures or accidents, hence its importance cannot be overlooked. There are several methods or tools that are used in risk quantification including Expert Opinion, Expected Monetary Value (EMV), Statistical Sums, Monte Carlo Simulations, and Decision Trees. Purpose of this article is provide an overview and importance of the concept of risk quantification in project management and review tools and techniques that are used in project risk quantification with application, advantages, and disadvantages of each tool. Further, limitations or challenges in project risk quantification are also analysed briefly at the end.
Introduction
Definition
Risk quantification is a process of evaluating the risks that have been identified and developing the data that will be needed for making decisions as to what should be done about them
[1]. PMBOK
[1] describes risk quantification as evaluating risks and risk interactions to assess the range of possible outcomes.
Inputs and Outputs of Risk Quantification
In risk quantification process of a project, there are inputs that should be considered with delegate care and as a result of risk quantification process outputs are generated. According to PMBOK, following inputs are considered and outputs are produced in risk quantification process of any project:
Table 1: Inputs and Outputs to Risk Quantification in Project Management
| Inputs
|
Outputs
|
| Stakeholder Risk Tolerance: Every organization and different individuals may have different tolerance for risk value
|
Opportunities to Pursue, Threats to Respond to: The list of opportunities that should be pursued and threats that should be taken care of.
|
| Sources of Risks: Categories of possible risk events that may negatively affect the outcome of a project. For example, Designs errors, stakeholder actions, or poor estimates etc.
|
Opportunities to Ignore, Threats to Accept: List of opportunities that can be ignored and threats that can be accepted.
|
| Potential Risk Events: Discrete occurrences that can occur during a project that may affect the outcome of the project. Such as natural disaster or departure of key member etc.
|
|
| Cost Estimates: Assessment of likely cost required to complete the project activities.
|
|
| Activity Duration Estimate: Quantitative assessment of likely number of work period required to activities of a project
|
|
Purpose and Concept
The objective of risk quantification is to prepare contingencies in terms of costs, time, or human resources and prioritize them in terms of their severity and likelihood, so that appropriate action can be taken accordingly. In order to quantify risk, it needs to be identified first. Once risk is identified then it is analyzed in terms of probability of occurrence and impact that it could print on the outcome. The probability is assigned either based on intuition or the previous data of failure rates available for similar events in datasheets. The probability of failure on Demand (PFD) of an event or a component is calculated by following formula.

Once probabilities of all events are calculated, a criterion for the likelihood of all the events is defined. For example, if a specific event may occur in exceptional circumstances, like for example <3% chance of occurrence, then its likelihood can be assigned as “Rare”. In a similar way, severity or consequence of the events on a project is also classified. For example, if an event may result in abandonment of project then it can be classified as “Catastrophic” or if it may result in a delay of 50% of schedule or 50% of additional cost then it may be classified as “Major”. The risk(R) is calculated by multiplying probability(P) with the impact(I) or severity.

Once risks are quantified then these are evaluated against a defined risk criteria or risk matrix. Red zone in a risk matrix may represent unacceptable risks, yellow zone as an acceptable risk, and green zone as neglectable risks. For example, if an event has a likelihood of class “Likely” and it has a severity class “Catastrophic” then it may lie in the red zone of the risk matrix. This may mean that this risk is not acceptable and appropriate or immediate actions should be applied to lower this risk into the acceptable zone or prepare contingencies. Figure 1 shows an example of risk matrix of a project. The first column represents criteria for likelihood, where, the first row represents criteria for consequence. Further, nature of any possible risk is defined based on both likelihood and consequence from low, moderate, high, to an extreme.
Importance
The term risk or risk assessment may sound like a modern scientific concept, but the idea of risk is as old as recorded human history. The gambling, the very essence of risk, was a popular pastime that inspired Pascal and Fermat’s revolutionary breakthrough into laws of probability
[2]. However, Risk as a scientific field is quite young. Around 30-40 years ago scientific journals, papers, and conferences started to cover this idea and principles on how to assess and manage risk
[3]. One of the main reasons of project failures is inadequate risk management. Figure 2 shows that 17% of projects fail due to inadequate risk management. Moreover, according to Standish Group (2013)
[4], 59% of IT projects overrun by original cost estimate and 74% are overrun by original time estimate. In software or IT projects, a number of factors contribute to the uncertain outcome of a project. Nogueira et al. (2014)
[5] concluded that when a scope is defined and software production teams are guided through the risk process then it becomes easier to take a rational decision. Present decisions may result in future losses or gains. If there is no risk assessment then banks will not be able to make decisions on which projects to finance and which not
[6]. Many construction projects fail to achieve their time, cost and quality goals due to several unforeseeable uncertain events like weather conditions, subcontractor failure, or different site conditions
[7]. Comprehensive risk assessment can help an organization to quantify risks and prepare contingencies beforehand so that projects can be completed in their original time, cost, and quality estimates.
This implies that the importance of risk assessment cannot be overlooked. First, risk quantification help in preparing contingencies for time and cost estimates. Second, It helps organizations in taking a rational decision in the presence of uncertainty. And third, it provides confidence of dealing unforeseeable events in future rather than acting irrationally.
Analysis of Risk Management Principles and Processes
Several standards exists that define principles of managing risks for effective risk management in an organization. Table 2 provides the comparison of risk management principles by PMBOK
[1], ISO 31000
[8], and PRINCE2
[9]. It can be seen that PMBOK
[1] and PRINCE2
[9] follow almost the same principles. This might be due to the fact that both standards are designed for project management practices. Whereas, ISO 31000
[8] lists a few similar principles and at the same instance also mentions somewhat different principles as well. The generality of the scope of ISO 31000 might be one of the reasons. Although, each standard does not explicitly describes the uncommon principles as listed in table 2, but these are meant to be the part of the risk management process. For example, ISO 31000
[8] clearly describes that human and cultural factors should be considered in risk management, while PRINCE2
[9] does not explicitly list this principle but clearly categorizes these risks separately.
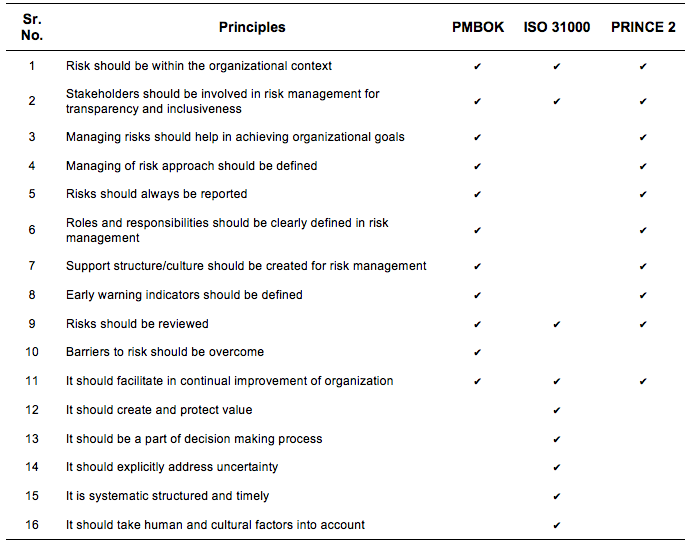
Table 2: Risk Management Principles
Figure 3 represents risk management processes of three standards. It can be seen that there is a small difference between processes of these standards, but when the definition of each step is critically analyzed, it can be realized that the basic concept behind all of these standards is not different. This implies different standards divide the risk management process into different steps but the core concepts remain the same. For example, PMBOK
[1] defines the third step as risk response development which means categorizing of assessed risks into acceptable or unacceptable risks and developing of responses accordingly. Whereas, almost the same definition exists for risk evaluation step in ISO 31000
[8].
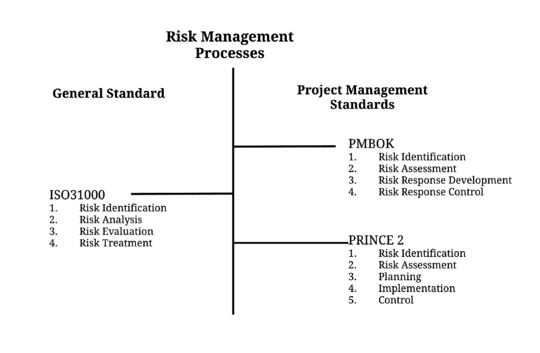
Figure 3: Risk Management Processes of different Standards
Applications
Methods
Several tools and techniques are used in order to apply risk quantification in projects. PMBOK
[1] provides 6 methods that can be used in risk quantification process. These tools and techniques are described briefly below, along with application, advantages, and disadvantages of each tool.
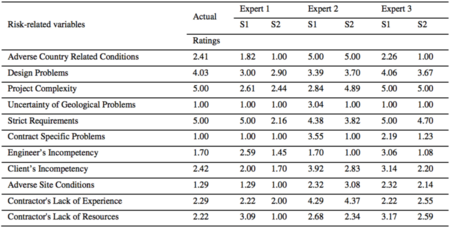
Figure 3: Example of expert opinion in a project (source: Yildiz A. Z. et al, “Using expert opinion for risk assessment: a case study of a construction project utilizing a risk mapping tool “, Procedia - Social and Behavioral Sciences, (2014), Vol. 119, pp. 519-528.)
Expert Opinion
Merriam Websterdefines expert opinion as, “a belief or judgment about something given by an expert on the subject”. Expert opinion is one of the risk quantification techniques. In expert opinion, risks are quantified based on the opinions of experts or senior executives based on their experiences. One of the best ways to use expert opinion is to conduct risk assessments workshops where experts can discuss and consequently assign values to the to the risks identified. But, this may lead to group bias and can affect the outcome. This bias can be minimized by using Delphi method, but there still be a chance of high variation in opinion.
[2] Although, expert opinion is not as concrete, as other methods may be, and may prone to personal subjectivity, but it is a very useful tool for risk quantification when data is scarce or no sufficient past experience is available or where risks are very company or project specific.
[3] Figure 3 shows an example of risk quantification using expert opinion in a case study on construction project conducted by Yildiz et al. (2014).
[10] The ratings are estimated ratings, quantified by SEM (Structural Equation Modeling)
[4] software based on the sub risks and attributes ratings assigned by experts using 1-5 Likert Scale.
[5]
Expected Monetary Value (EMV)
Expected monetary value is another way to quantify risk. According to PMBOK
[1], expected monetary value is a product of two numbers, risk probability value and risk event value which is an estimate of loss or gain that will be incurred if the risk event occurs. These values can be positive and negative resulting in gain or loss respectively. For example, if there is 60% probability than a certain equipment will fail during a project that will result in USD10,000, then EMV will be USD -6,000. Figure 4 shows an example of EMV analysis. It can be perceived that a total of USD4,500 are required as contingency, but as all of the events are not going to happen. This means, the risks which are not going to happen will add their value to EMV pool, where risks that are going to happen will utilize value from this pool. Hence, for this example, a project manager can add extra USD1,100 into project budget as contingency.
[6] EMV helps project managers in two ways. First, it helps to manage estimate the amount required to manage all identified risks. Second, it helps in selecting the choice to manage the risk by selecting the option with minimum value.
[7]
EMV is generally used as an input to further analysis, for example, in
decision trees. Benefits of using EMV are that it provides help in calculating contingency reserves, in procurement planning decision making, in spreading impact of large number of risks, and in decision tree analysis. Whereas, drawbacks of using this technique are that this technique is not used in samall and small-medium sized projects, use of expert opinion may result in personal bias, and chance of forgetting of inclusion of positive risks.
[8] Statistical Sums
Statistical sums is another way to quantify risks. In this technique cost estimates of individual work items are calculated and then are used to calculate range of total project costs using statistical probability distribution. The range of different project costs can help to quantify relative risks of alternative project budgets (PMBOK)
[1]. In this method, instead of using one point estimate, 3 point estimates are used. Cost of each work item is estimated through 3 points of likelihood i.e. low, likely, and high. Then statistical distribution such as normal distribution or beta distribution is used to calculate mean and variance. To calculate mean and variance of total project estimate, means and variances are added together for all work items. Figure 5 shows an example of this method. It is an easy technique for calculating budget and time contingency of a project, but it cannot be used for unforeseeable risks that may happen during a project. Further, as estimates are provided on expert opinion bases so it may subject to personal bias.
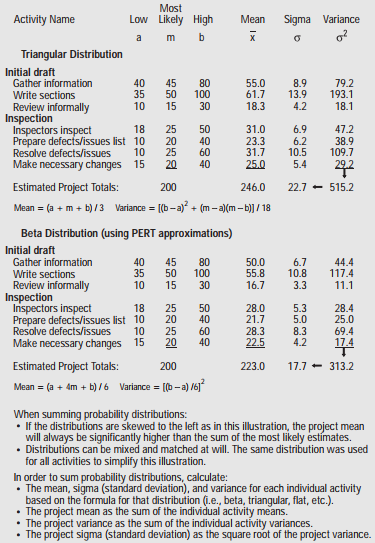
Figure 5: Example of Statistical Sums (3 point estimates) (source: Duncan W. R., “A Guide to Project Management Body of Knowledge (PMBOK)”, PMI Standards Committee, (2013))
Monte Carlo Analysis or Simulation
Monte Carlo is a computerized mathematical simulation technique that is used to quantify risks in project management. This technique is helpful in seeing the probable outcomes of decisions and assesses the impact of risk that is useful in decision making
[9]. Most likely and least likely estimates of risks are provided for each event and then these estimates are summed together to calculate a range of possible outcome. Monte Carlo simulation then generates random values between the range and calculates the number of occurrences the value lies within each possible outcome
[11]. This probability is then distributed and the decision is made based on the most probable outcome.
For example, if there are three tasks required in an e-learning project. Best case, most likely, and worst case estimates of all the tasks required are given in figure 5. It can be seen that the project is most likely to complete in between 11 and 23 days. Now for example, if Monte Carlo simulation is run 500 times generating random values between 11 and 23. The total number of times the simulation result was less than or equal to projected duration is calculated as shown in figure 6. Then, the probability of each projected duration is calculated and distributed as shown in figure 7. It can be seen that, from figure 5, the most likely projected completion time is 17 days. But, as per figure 7, Monte Carlo simulation shows that likelihood of project completion in 17 days is almost 33%. Whereas, the likelihood of project completion in 19 days is 88%. Hence, it can be estimated that the project will most likely complete in 19 to 20 days. [10]
Monte Carlo simulation is usually used in cost and schedule estimation. It can also be used in large projects or programs. The benefits of using Monte Carlo are easiness of tool, numerical estimation, and greate level of confidence [11]. Whereas drawbacks or challenges are the use of right distribution as wrong distribution may lead to wrong results, input estimates as right estimates are required to produce right results, and use of right mathematical formula in the software.[12]
Decision Trees
Decision tree is a tool that uses tree-like graph or model of decisions and their corresponding consequences
[13] that can be used to quantify risks and make a decision under uncertainty in a project. Expected Monetary Value (EMV) is usually used to quantify risks, where probability(P) of an event is multiplied by its impact(I) to calculate the EMV
[12][13][14][15][16]. For example, if there is a decision to make in a project under uncertainty that whether make a prototype or not in a project. This decision has only two options, prototype and no prototype, shown in figure 9. Each of these choices has two consequences, success or failure. The probability of each consequence is also shown in figure 9. Impact in terms of costs for each option or chance and consequence or outcome is also shown in figure 9. Net path value for prototype with 70% success is equal to payoff minus prototype cost i.e. $500,000 - $100,000 = +$400,000. Similarly, net path values for rest of the paths are also shown in figure 9. EMV value for the path option of prototype is then calculated as [70%*($400,000) + 30%*(-$150,000)] = +$235,000. Similarly, the EMV value for no prototype is -$100,000. Hence, EMV value at decision node will be +$235,000, which means that the project manager should decide to select prototype option as the other option actually gives a loss.
[14]
Benefits of using decision tree analysis are ease of understanding and implementation, quantification of even little hard data, and a possibility to add several new scenarios. While disadvantages are biases of input data and increase in complexity for a large number of outcomes that are linked together.
[15] Selection of Technique
Selecting the right technique for right project can be tedious. Several factors can influence on the selection of the right technique for the right project. Some of these factors include:
- Resources and capabilities required to execute a certain risk quantification method
- Degree of uncertainty in the project
- Complexity of the project
- Availability of the past data
Table 3 shows a framework for selecting the right method based on the nature of the project. (This framework provides author’s subjective analysis and hence prone to disagreement.)
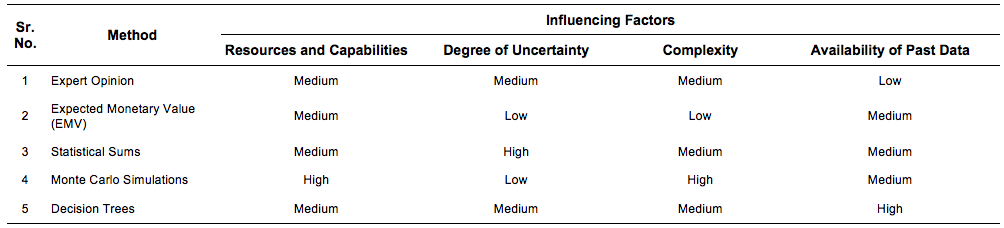
Table 3: Influencing factors in selecting the right technique
Limitations and Challenges
One of the limitations in risk quantification is that probabilities are estimated either by past history or in some cases by expert opinion or intuition. Both of these cases cannot define the probability of an event with 100% certainty, which means no matter how much effort is put in risk quantification process, it can never be completely accurate. Another challenge is the quantification of the impact in term of cost or time. It is very difficult to correctly estimate the exact cost of the impact or consequence even with utmost care. Nonetheless, risk quantification provides contingencies in terms of costs and time, but still several unforeseeable events can occur that may result in a project failure. Hence, risk can be quantified to a certain extent, but full confidence level cannot be assured. Further, methods or tools that are used in risk quantification process of a project, as mentioned in section 2, try to reduce the uncertainty level to some extent and help build up confidence level but the inputs to these methods are also prone to limitations of intuition and hence pose limitations in accurate risk assessment.
All these facts, make one questions that when risk assessment or quantification cannot guarantee the success of a project then why do managers invest so much effort and money into risk assessment. The answer lies in a famous phrase “better than nothing”. It is always better to perform risk assessment beforehand and be prepared and control for uncertain events than drastically act on uncertain events unprepared when they occur. [further writing in process....]
Annotated Bibliography
References
- ↑ 1.0 1.1 1.2 1.3 1.4 1.5 1.6 [Duncan W. R., “A Guide to Project Management Body of Knowledge (PMBOK)”, PMI Standards Committee, (2013).]
- ↑ [Bernstein P.L., “Against the Gods: The remarkable story of risk”, John Wiley & Sons, New York, (1996).]
- ↑ [Aven T., “Risk assessment and risk management: Review of recent advances on their foundation”, European journal of operational research, (2016), Vol. 253, No. 1, pp. 1-13.]
- ↑ [Standish. THE CHAOS MANIFESTO. Standish Group, Boston (2013).]
- ↑ [Nogueira, Marcelo, and Ricardo J. Machado. “Importance of Risk Process in Management Software Projects in Small Companies.” Ifip Advances in Information and Communication Technology, Vol. 439, No. 2, (2014), pp. 358–365. Web.]
- ↑ [Bernadete Junkes, M., Anabela P. Tereso, and Paulo S. L. P. Afonso. “The Importance of Risk Assessment in the Context of Investment Project Management: a Case Study.” Procedia Computer Science 64 (2015): pp. 902–910. Web.]
- ↑ [Mustafa, Mohammad A., and Jamal F. Al-Bahar. “Project Risk Assessment Using the Analytic Hierarchy Process.” Ieee Transactions on Engineering Management, Vol. 38, No.1, (1991), pp. 48-50. Print.]
- ↑ 8.0 8.1 8.2 8.3 [ISO 31000: Risk Management - Principles and Guidelines. (2009).]
- ↑ 9.0 9.1 9.2 [PRINCE2: A Practical Handbook, PRINCE2. (2009). Prince2: a Practical Handbook. Butterworth-Heinemann.]
- ↑ [Yildiz A. Z. et al, “Using expert opinion for risk assessment: a case study of a construction project utilizing a risk mapping tool “, Procedia - Social and Behavioral Sciences, (2014), Vol. 119, pp. 519-528.]
- ↑ [Ahmed, A. et al. (2003a), “A conceptual framework for risk analysis in concurrent engineering”, (R1.6 Paper No. 86), Proceedings of the 17th International Conference on Production
Research, 4-7 August, Blacksburg, Virginia, USA.]
- ↑ [Clemen, R.T., Making Hard Decisions: An Introduction to Decision Analysis, Druxbury Press, New York, NY. (1996).]
- ↑ [Russell, R.S. and Taylor, B.W. III, Operations Management, Prentice-Hall Inc., Upper Saddle River, NJ, (2000).]
- ↑ [Clemen, R.T. and Reilly, T., Making Hard Decisions with Decision Tools, Druxbury Thomson Learning, Toronto, (2001).]
- ↑ [Perry, J.G. and Haynes, R.W., “Risk and its management in construction projects”, Proceedings of Institution of Civil Engineers, (1985), pp. 499-521.]
- ↑ [Ahmed, Ammar, Berman Kayis, and Sataporn Amornsawadwatana. “A Review of Techniques for Risk Management in Projects.” Ed. by S.C.L. Koh. Benchmarking, Vol. 14, No.1, (2007), pp. 22–36. Web.]


