Earned Value Analysis
(→Project Controlling) |
|||
| (32 intermediate revisions by 2 users not shown) | |||
| Line 1: | Line 1: | ||
| − | In order to measure performance in terms of cost, time and work progress, the '''Earned Value Analysis (EVA)''' is introduced as a suitable method, offering quantitative analysis techniques as well as objective performance indicators <ref name="Andrew">Baldwin, Andrew and Bordoli, David (2014) A Handbook for Construction Planning and Scheduling, Chapter 6, p.158, First Edition, Jonn Wiley & Sons</ref>.Besides giving an overview of the method itself and the steps, which must be followed in order to carry out an EVA, the requirements on both structural and methodological level are presented and the key benefits are outlined. In addition to its’ primary area of application as a tool within project controlling, the extended | + | ''*Disclaimer: The articles are created by DTU students. As part of the course, students are introduced to knowledge related to IP rights, plagiarism and copyright infringement. Additionally, the articles are a product of critical engagement of students with the literature review, and their aim is to contribute to the Project Management holistic field of science. If you discover any potential copyright infringement on the site, please inform thereof by sending an email to ophavsret@dtu.dk.'' |
| + | |||
| + | |||
| + | |||
| + | ''Developed by Magnus Schulz'' | ||
| + | |||
| + | |||
| + | In order to measure performance in terms of cost, time and work progress, the '''Earned Value Analysis (EVA)''' is introduced as a suitable method, offering quantitative analysis techniques as well as objective performance indicators <ref name="Andrew">Baldwin, Andrew and Bordoli, David (2014) A Handbook for Construction Planning and Scheduling, Chapter 6, p.158, First Edition, Jonn Wiley & Sons</ref>.Besides giving an overview of the method itself and the steps, which must be followed in order to carry out an EVA, the requirements on both structural and methodological level are presented and the key benefits are outlined. In addition to its’ primary area of application as a tool within project controlling, the extended sphere of influence of the method across the entire organization is shown. All technical contents are being demonstrated based on illustrative examples. | ||
---- | ---- | ||
| Line 40: | Line 47: | ||
|} | |} | ||
| − | Figure | + | Figure 1 shows a typical curve of the cumulated PV for a project. The exact form of this curve will vary for each project depending on the activities, costs and timing of the construction work. Figure 2 illustrates the relation between PV, AC and EV, Figure 3 additionally shows the cost-and schedule variance: |
<gallery widths=450px heights=280px perrow=3> | <gallery widths=450px heights=280px perrow=3> | ||
| − | File:Planned Value Curve.jpg|Figure | + | File:Planned Value Curve.jpg|Figure 1 - Planned Value Curve |
| − | File:PV AC EV.jpg|Figure | + | File:PV AC EV.jpg|Figure 2 - Planned Value, Actual Cost and Earned Value. In this favorable scenario, the EV exceeds the planned value, and the AC is even below the PV |
| − | File:Forecast.jpg|Figure | + | File:Forecast.jpg|Figure 3: Schedule Variance (SV) and Cost Variance (CV), as well as predicted values at completion |
</gallery> | </gallery> | ||
<br clear=all> | <br clear=all> | ||
| − | The '''Budget at Completetion (BAC)''' describes the total planned budget of a project or work package, and thus the total value which is to be created when completed. When re-estimations or re-scheduling is taking place, the resulting new value is called Estimate at Completion (EAC), which will be specified in detail later on in the chapter ''Forecasting'' | + | The '''Budget at Completetion (BAC)''' describes the total planned budget of a project or work package, and thus the total value which is to be created when completed. When re-estimations or re-scheduling is taking place, the resulting new value is called '''Estimate at Completion (EAC)''', which will be specified in detail later on in the chapter ''Forecasting''. |
The '''Schedule Performance Index (SPI)''' is the ratio of the EV divided by the PV, usually expressed as a percentage. It therefore expresses the relation between planned and actually achieved work, or in other words answers the question "How are we doing against the plan?". | The '''Schedule Performance Index (SPI)''' is the ratio of the EV divided by the PV, usually expressed as a percentage. It therefore expresses the relation between planned and actually achieved work, or in other words answers the question "How are we doing against the plan?". | ||
| Line 66: | Line 73: | ||
|} | |} | ||
| − | == Requirements and | + | == Requirements and process of preparation== |
In order to successfully execute an Earned Value Analysis, the following systematic preconditions and requirements must be fulfilled<ref name="Dua">Raf Dua (1999) Implementing Best Practice in Hospital Project Management Utilising EVPM methodology</ref>. | In order to successfully execute an Earned Value Analysis, the following systematic preconditions and requirements must be fulfilled<ref name="Dua">Raf Dua (1999) Implementing Best Practice in Hospital Project Management Utilising EVPM methodology</ref>. | ||
| Line 72: | Line 79: | ||
'''1) Time-based schedule''' | '''1) Time-based schedule''' | ||
| − | The measurement of progress is made on the basis of a work schedule, which must be defined and agreed, including a clear timeline and an estimation of time required per individual activity (s. Figure | + | The measurement of progress is made on the basis of a work schedule, which must be defined and agreed, including a clear timeline and an estimation of time required per individual activity (s. Figure 4). |
'''2) Work Breakdown Structure''' | '''2) Work Breakdown Structure''' | ||
| Line 79: | Line 86: | ||
'''3) Cost Assessment''' | '''3) Cost Assessment''' | ||
| − | [[File:WBS Schedule.jpg|350px|thumb|right|Figure | + | [[File:WBS Schedule.jpg|350px|thumb|right|Figure 4: Exemplary WBS- Schedule]] |
| − | A cost collection system including an appropriate association of cost estimates must be implemented and executed in order to provide exact estimates of the effort of a certain activity (s. Figure | + | A cost collection system including an appropriate association of cost estimates must be implemented and executed in order to provide exact estimates of the effort of a certain activity (s. Figure 4). Whereas some activities are directly linked to the consumption of materials, usage of machines, purchases of products and services or travels, the most valuable cost commodity is probably time. Tracking the labour time it takes to fulfill a certain work package represents a major task within assessing it’s cost. Therefore, a direct link to the schedule is given at this point, often leading to a re-assessment of the schedule made<ref name="Raby" />. The cost can then be cumulated, often generating the traditional S-curve of the project plan. By doing so continuously in the course of the working process, the actual cost, as well as the cost for given time periods, e.g. per week/month can be obtained. |
'''4) Progress measurement''' | '''4) Progress measurement''' | ||
| Line 97: | Line 104: | ||
| − | === Organizational | + | === Organizational level - Earned Value Management System (EVMS) === |
Fulfilling the requirements for an EVA stated above represent a challenge for organizations, but at the same time, when executed systematically, it can lead to an overall growth of maturity and transparency throughout the entire value chain<ref name="Andrew" />. Therefore, these measures can be embedded in an '''Earned value management System (EVMS)''', using a dedicated process, procedures, tools and templates. | Fulfilling the requirements for an EVA stated above represent a challenge for organizations, but at the same time, when executed systematically, it can lead to an overall growth of maturity and transparency throughout the entire value chain<ref name="Andrew" />. Therefore, these measures can be embedded in an '''Earned value management System (EVMS)''', using a dedicated process, procedures, tools and templates. | ||
| − | The Electronic Industries Alliance (EIA) has release a standard regarding EVMS which contains a set of 32 Guidelines, defines the requirements that an Earned Value Management System (EVMS) must meet. These guidelines represent a management approach on organizational level, that once incorporated on any type of program, whether research and development, construction, production, etc. provides all levels of management with | + | The Electronic Industries Alliance (EIA) has release a standard regarding EVMS which contains a set of 32 Guidelines, defines the requirements that an Earned Value Management System (EVMS) must meet. These guidelines represent a management approach on organizational level, that once incorporated on any type of program, whether research and development, construction, production, etc. provides all levels of management with an insight into cost, schedule and scoping issues. It addresses EVMS in 5 different dimensions<ref name="EIA">National Defense Industrial Association, Integrated Program Management Division (2014), ''EIA-748-EVMS Standard, Revision C Intent Guide'', p. 4-51</ref><ref name="Hunter">Howard Hunter, Richard Fitzgerald, Dewey Barlow (2014), ''Improved cost monitoring and control through the Earned Value Management System'', Acta Astronautica 93, p. 497-500</ref>: |
*'''Organization''' | *'''Organization''' | ||
| Line 132: | Line 139: | ||
---- | ---- | ||
| − | === Project | + | === Project controlling === |
As pointed out earlier, the EVA method perfectly serves the purpose of controlling entire projects. Using the Work Breakdown Structure in order to monitor the elements of work at the required level of detail, the Earned Value (EV) can be assessed and measured against the Planned Value (PV). This can either be done by simply allocating a proportion of the total PV to each activity, or by predicting the time, materials and other cost factors related to it. | As pointed out earlier, the EVA method perfectly serves the purpose of controlling entire projects. Using the Work Breakdown Structure in order to monitor the elements of work at the required level of detail, the Earned Value (EV) can be assessed and measured against the Planned Value (PV). This can either be done by simply allocating a proportion of the total PV to each activity, or by predicting the time, materials and other cost factors related to it. | ||
| Line 193: | Line 200: | ||
| 150€ | | 150€ | ||
| 100€ | | 100€ | ||
| − | | | + | | 33 |
| 50€ | | 50€ | ||
| 70€ | | 70€ | ||
| Line 222: | Line 229: | ||
| − | '''Earned Value: EV(5)''' = PV x Progress (%) = 150€ x | + | '''Earned Value: EV(5)''' = PV x Progress (%) = 150€ x 33% = 50€ |
'''Schedule Variance: SV(5)''' = EV - PV = 50€ - 100€ = -50€ | '''Schedule Variance: SV(5)''' = EV - PV = 50€ - 100€ = -50€ | ||
| Line 228: | Line 235: | ||
'''Cost Variance: CV(5)''' = EV - AC = 50€ - 70€ = -20€ | '''Cost Variance: CV(5)''' = EV - AC = 50€ - 70€ = -20€ | ||
| − | This shows | + | This shows that on the one hand, activity 5, having created 33% of its' total value, is behind schedule by - 50€ as indicates the SV. In other words, the output is not as high as it should be according to schedule. On the other hand, the cost variance (CV) indicates that the input is 20€ higher than planned with actual costs of 70€ compared to 50€ value created. |
Generally, the analysis reveals that activities 4 and 5 are in fact the ‘problem activities’. Both are behind schedule and over cost. It is also noted from the table that activity 1 was completed under the original budgeted cost but activity 2 was over budget. According to the data collected, Activity 6 is ahead of schedule and on cost. | Generally, the analysis reveals that activities 4 and 5 are in fact the ‘problem activities’. Both are behind schedule and over cost. It is also noted from the table that activity 1 was completed under the original budgeted cost but activity 2 was over budget. According to the data collected, Activity 6 is ahead of schedule and on cost. | ||
| + | |||
| + | The overall negative impression is confirmed by taking into account the following overall project KPIs: | ||
| Line 240: | Line 249: | ||
The SPI < 1 indicates that the project is clearly delayed significantly, whereas the CPI < 1 reveals an unfavorable situation in terms of cost efficiency. | The SPI < 1 indicates that the project is clearly delayed significantly, whereas the CPI < 1 reveals an unfavorable situation in terms of cost efficiency. | ||
| − | Kedi and Hongping (2010) furthermore provide guidance for an interpretation for the SPI, including recommended actions (s. Table | + | Kedi and Hongping (2010) furthermore provide guidance for an interpretation for the SPI, including recommended actions (s. Table 2) |
{| class="wikitable" style="text-align:left" | {| class="wikitable" style="text-align:left" | ||
| Line 264: | Line 273: | ||
=== Forecasting === | === Forecasting === | ||
| − | + | It is one of the main tasks of a project manager to control the overall tendency of a project and to evaluate, whether a certain delay or increase of cost will be critical for its' outcome or not. Since a quantification of the delay and cost overrun is key to inform project-related stakeholders and to choose the right countermeasures, forecasting time and cost of in a project are very important. Figure 5 shows a case, in which the AC clearly exceed the PV (BCWP), leading to an increased EAC. | |
| − | + | ||
| − | It is one of the main tasks of a project manager to control the overall tendency of a project and to evaluate, whether a certain delay or increase of cost will be critical for its' outcome or not. Since a quantification of the delay and cost overrun is key to inform project-related stakeholders and to choose the right countermeasures, forecasting time and cost of in a project are very important. Figure | + | |
Generally, the calculations made in EVA and the frequent review of the underlaying values can be used for the forecasts of the anticipated project completion and the cost at completion, as well their expected variance<ref name="Andrew" />: | Generally, the calculations made in EVA and the frequent review of the underlaying values can be used for the forecasts of the anticipated project completion and the cost at completion, as well their expected variance<ref name="Andrew" />: | ||
| − | + | [[File:Forecasting.png|thumb|right|350px|Figure 5: Forecast of CEAC compared to the PV (BCWP)<ref name="Kedi" />]] | |
* Cost estimate at completion (CEAC) | * Cost estimate at completion (CEAC) | ||
* Cost variance at completion (CVAC) | * Cost variance at completion (CVAC) | ||
| Line 294: | Line 301: | ||
CEAC = AC + ((BAC-EV) / CPI) | CEAC = AC + ((BAC-EV) / CPI) | ||
| − | = | + | = 430€ + (660€ - 410€) / 0,95 |
| − | = | + | = 430€ + 263,16€ |
| − | '''= 693, | + | '''= 693,16€''', resulting in an overall CVAC of |
CVAC = BAC - CEAC | CVAC = BAC - CEAC | ||
| − | = | + | = 660€ - 693,16€ |
| − | = '''- 33,16''' | + | = '''- 33,16'€''' |
indicating that the total cost at the end of activity 6 will probably be 33,16€ higher than originally planned. | indicating that the total cost at the end of activity 6 will probably be 33,16€ higher than originally planned. | ||
The time estimated at completion (TEAC) can be determined using the renewed agent on the basis regular reviews. The revised completion date can be adjusted through the evaluation of the following factors: | The time estimated at completion (TEAC) can be determined using the renewed agent on the basis regular reviews. The revised completion date can be adjusted through the evaluation of the following factors: | ||
| + | |||
*Schedule Performance Index (SPI). | *Schedule Performance Index (SPI). | ||
*Anticipated staffing changes. | *Anticipated staffing changes. | ||
| Line 315: | Line 323: | ||
Afterwards, the TVAC can be calculated as the difference between originally planned finishing schedule and TEAC<ref name="Kedi" />. | Afterwards, the TVAC can be calculated as the difference between originally planned finishing schedule and TEAC<ref name="Kedi" />. | ||
| − | == Key | + | == Key benefits == |
| − | + | As pointed out earlier, the EVA method requires a number of systematic characteristics within in organization in order to be applied successfully. Therefore, an overall benefit of the method is, that is provides a framework for organizations to improve their overall process quality and information provision structure<ref name="Lukas" />. Besides benefiting from the results of the EVA itself, the overall learning effect which necessarily takes place during the process of implementation includes | |
| + | |||
| + | *Increased information supply across different hierarchies <ref name="Ferguson" /> | ||
| + | *Systematical ensured overall completion of budgeting and resource allocation <ref name="Ferguson" /> | ||
| + | *increased cost awareness throughout the organization | ||
| − | The main benefits of EVA as an assessment method of progress are the following: | + | The main, direct benefits of EVA as an assessment method of progress are the following: |
* Uniform measure of progress (in time or money) and therefore allows to make simple measurements in complex situations <ref name="Raby" /> | * Uniform measure of progress (in time or money) and therefore allows to make simple measurements in complex situations <ref name="Raby" /> | ||
| Line 325: | Line 337: | ||
* Risk mitigation and management due to regular reviews and overall, tangible performance measurement regarding project scope, schedule, and budget <ref name="Hayes"> Hayes, Heather (2002) Using Earned-Value Analysis to Better Manage Projects, Pharmaceutical Technology, Feb 2002., p.80</ref> | * Risk mitigation and management due to regular reviews and overall, tangible performance measurement regarding project scope, schedule, and budget <ref name="Hayes"> Hayes, Heather (2002) Using Earned-Value Analysis to Better Manage Projects, Pharmaceutical Technology, Feb 2002., p.80</ref> | ||
* Facilitates decision making and performance improvement | * Facilitates decision making and performance improvement | ||
| − | * Enables project managers to provide estimation of overall project outcome through forecasting | + | * Enables project managers to provide estimation of overall project outcome through forecasting |
| − | + | ||
| − | + | ||
| − | + | ||
| − | + | ||
== Limitations and pitfalls== | == Limitations and pitfalls== | ||
| − | + | With reference to the benefits stated above, the point "organizational readiness" can at the same time represent the main obstacle for companies to implement Earned Value Analysis as a tool. The major requirement to establish a complete and detailed WBS and underpin the resulting plan with cost- and budget data on a regular basis, which is hard to achieve in an organization which doesn't have in place the required information infrastructure<ref name="Howes" />. This means the ability to gather and process schedule, cost and budget metrics, e.g. the effort it takes to determine and quantify the real progress made or the actual cost of a project, including those cost that have been caused but for which no invoice has been received <ref name="Kedi" />. | |
| − | Lukas (2008) points out several reasons which in reality lead to failure of EVA<ref name="Lukas" />: | + | Additionally, Lukas (2008) points out several reasons which in reality lead to failure of EVA<ref name="Lukas" />: |
* the requirements are not defined or incomplete; | * the requirements are not defined or incomplete; | ||
| − | * WBS not used, not accepted or incomplete; | + | * the WBS is not used, not accepted or incomplete; |
| − | * project plan not integrated (WBS-Schedule-Budget); | + | * the project plan is not integrated (not reflecting in WBS-Schedule-Budget); |
| − | * schedule and/or budget | + | * the schedule and/or budget are planned incorrectly; |
| − | * change management not used or ineffective; | + | * the change management is not used or used ineffective; |
| − | * cost collection system inadequate; | + | * the cost collection system is inadequate; |
| − | * progress not measured correctly | + | * the progress not measured correctly |
Furthermore, he states that a major limitation is that an SPI > 1.0 does not necessarily indicate that a project is ahead of schedule. The reason is that accomplishing more work than planned by working on non-critical path work packages might still indicate a higher EV. Accordingly, this requires to look at project float to determine whether you are ahead, on or behind schedule. This points into the direction of another limitation, stated by Raby (2000), saying that EVA provides variances, but it does not indicate the cause and the effect on the critical path of the project <ref name="Raby" />. This is underpinned by the investigation of Howes (2000), who in his work identifies the major weakness of EVA, not taking into account the sequence of work packages, which has been created through network analysis. Instead, the violation of the project plan is described using overall project cost and thus lacks a level of detail and concreteness in terms of the individual activities significance. <ref name="Howes" /> | Furthermore, he states that a major limitation is that an SPI > 1.0 does not necessarily indicate that a project is ahead of schedule. The reason is that accomplishing more work than planned by working on non-critical path work packages might still indicate a higher EV. Accordingly, this requires to look at project float to determine whether you are ahead, on or behind schedule. This points into the direction of another limitation, stated by Raby (2000), saying that EVA provides variances, but it does not indicate the cause and the effect on the critical path of the project <ref name="Raby" />. This is underpinned by the investigation of Howes (2000), who in his work identifies the major weakness of EVA, not taking into account the sequence of work packages, which has been created through network analysis. Instead, the violation of the project plan is described using overall project cost and thus lacks a level of detail and concreteness in terms of the individual activities significance. <ref name="Howes" /> | ||
| − | |||
| − | |||
== References == | == References == | ||
| Line 353: | Line 359: | ||
<references /> | <references /> | ||
| − | == | + | == Annotated bibliography == |
| + | |||
| + | '''Baldwin, Andrew and Bordoli, David (2014) ''A Handbook for Construction Planning and Scheduling'':''' This chapter of the handbook explains the basis of the technique and the EVA methodology. It outlines what is needed for an EVA system and how to use it successfully, identifying common pitfalls and how to overcome them in the context of construction activities, providing very helpful examples and graphs. | ||
| + | |||
| + | '''Lukas, Joseph (2008) Earned Value Analysis – ''Why it Doesn't Work'':''' Lukas provides a differentiates view on EVA from a practical point of view. In his article, he very critically reflects upon EVA, outline the design of the method and its' intentional application, but then very strictly works out the limitations and issues one has when using EVA in reality. As the title suggest, his position towards EVA is rather negative. | ||
| + | |||
| + | '''Raf Dua (1999) ''Implementing Best Practice in Hospital Project Management Utilising EVPM methodology'':''' Dua applies EVA in the context of Earned Value Performance Management (EVPM) within the optimization of risk management and process control in hospital project management. His motivation is that healthcare sector usually does not face the competitive pressure as other industries. He therefore works out and describes extensively the EVM methodology and the implementation requirements in order introduce these to hospital sector, providing a case study and special research in that area. | ||
| + | |||
| + | '''Howes, R. (2000) ''Improving the performance of Earned Value Analysis as a construction project management tool'':''' Howes, similar to Lukas stated above, takes a rather critical position towards EVA. In his paper, he attempts to refine and improve the performance of traditional EVA by the introduction of a hybrid methodology based on work packages and logical time analysis entitled Work Package Methodology (WPM). In a nutshell, he in his approach applies EVA calculations to individual work packages in order to take into consideration their unique characteristics. | ||
| + | |||
| + | '''Michael Raby (2000), ''Project management via earned value'':''' This article very clearly outlines the main characteristics of EVA and the benefits of its' application in project management. While doing so in a nicely summarized way, he provides a quick introduction and a step-by-step guide for execution of the method. | ||
| + | |||
| + | '''National Defense Industrial Association, Integrated Program Management Division (2014), ''EIA-748-EVMS Standard, Revision C Intent Guide'':''' This intent guide describes the main requirements within the EIA standard for EVMS and the 32 key consideration to be included. The very specific instructions are summarized, clustered in 5 dimensions and their overall relevance for businesses is explained. | ||
| + | |||
| + | '''Howard Hunter, Richard Fitzgerald, Dewey Barlow (2014), ''Improved cost monitoring and control through the Earned Value Management System'':''' This article introduces EVMS in order to optimize performance measurement in Space Department. In order to provide a consistent, standard framework for assessing project performance, which has already been implemented in a reference project, the key characteristics are summarized nicely before the article very specifically treat the particularities of the case study. | ||
| + | |||
| + | '''Ferguson, J., Kissler, K.H. (2002), ''Earned Value Management'':''' A very quick but convenient introduction to the EVM requirements, objectives, followed by a general application in the contracting environment of the european institute for nuclear research (CERN). | ||
| + | |||
| + | '''Kedi, Zhu and Hongping, Yang (2010), ''Application of Earned Value Analysis in Project Monitoring and control of CMMI'':''' This article reflects upon EVA as a software project controlling method in the context of the CMMI maturity model. They provide detailed schemes for interpretation of EVA indicators. Furthermore, the methods applicability is linked to the overall capabilities of an organization to provide cost, schedule and budget metrics. | ||
| + | |||
| + | '''Hayes, Heather (2002) ''Using Earned-Value Analysis to Better Manage Projects'':''' A short introduction to the benefits of EVA, followed by a description of it's relevance for pharmaceutical sector according to a generic example. | ||
| + | |||
| + | [[Category:Project Management]][[Category:Resources]][[Category:Earned Value Analysis]][[Category:Finance]][[Category:Uncertainty]][[Category:Tool]] | ||
Latest revision as of 11:35, 17 May 2019
*Disclaimer: The articles are created by DTU students. As part of the course, students are introduced to knowledge related to IP rights, plagiarism and copyright infringement. Additionally, the articles are a product of critical engagement of students with the literature review, and their aim is to contribute to the Project Management holistic field of science. If you discover any potential copyright infringement on the site, please inform thereof by sending an email to ophavsret@dtu.dk.
Developed by Magnus Schulz
In order to measure performance in terms of cost, time and work progress, the Earned Value Analysis (EVA) is introduced as a suitable method, offering quantitative analysis techniques as well as objective performance indicators [1].Besides giving an overview of the method itself and the steps, which must be followed in order to carry out an EVA, the requirements on both structural and methodological level are presented and the key benefits are outlined. In addition to its’ primary area of application as a tool within project controlling, the extended sphere of influence of the method across the entire organization is shown. All technical contents are being demonstrated based on illustrative examples.
Contents |
[edit] Terms and definitions
The Earned Value Analysis is defined as a quantitative technique of performance measurement, using estimates of both work progress and related cost to determine the overall efficiency of a respective activity, work package or project[1]. In order to do so, it compares the scope of the project, the schedule of work and the work undertaken in order to determine the status, the likely completion and the out-turn cost of the observed object.
The basic values, which are used in this calculation are the following[2]:
The Planned Value (PV) are the budgeted cost of the work, which must be completed according to a specified schedule. It is therefore also referred to as the Budgeted Cost of Work Scheduled (BCWS) or as Planned Value (PV) and includes all labour, material, and other cost which is related to specific working steps.
The Actual Cost (AC) describe the cost of the work which has already been accomplished and can also be called the Actual Cost of Work Performed (ACWP)
The Earned Value (EV), also called the Budgeted Cost of Work Performed (BCWP) is an indicator for the value of the work accomplished. It can be determined by calculating the percentage of the total budget which is actually completed at that specific point of time:
| Earned Value (EV) = Total Budget x Work Progress |
These values then serve to calculate additional indicators, which describe how the actual values deviate from the planned values and thus provide important information on how the project is doing.
The Cost Variance (CV) is the algebraic difference between the earned value and the actual cost:
| Cost Variance (CV) = Earned Value (EV) - Actual Cost (AC) |
A positive value indicates a favourable condition. A negative value indicates an unfavourable condition. The cost variance may be expressed as a value for a specific period or as a cumulative value to date.
The Schedule Variance (SV) is a metric for the schedule performance derived from EV metrics and, as the algebraic difference between earned value and planned value, indicates if the progress is on schedule.
| Schedule Variance SV = Earned Value (EV) - Planned Value (PV) |
Figure 1 shows a typical curve of the cumulated PV for a project. The exact form of this curve will vary for each project depending on the activities, costs and timing of the construction work. Figure 2 illustrates the relation between PV, AC and EV, Figure 3 additionally shows the cost-and schedule variance:
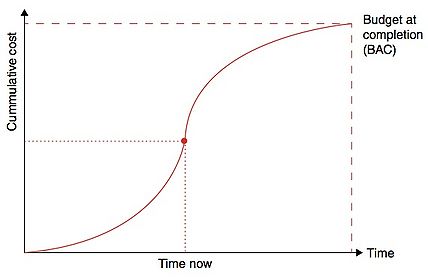
Figure 1 - Planned Value Curve
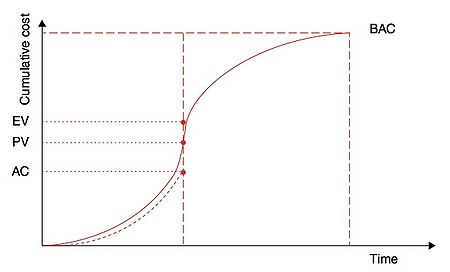
Figure 2 - Planned Value, Actual Cost and Earned Value. In this favorable scenario, the EV exceeds the planned value, and the AC is even below the PV
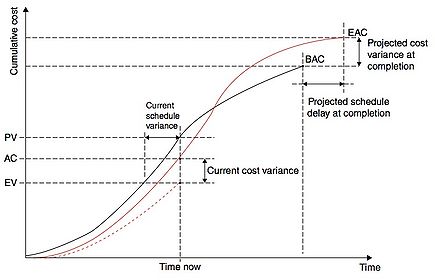
Figure 3: Schedule Variance (SV) and Cost Variance (CV), as well as predicted values at completion


The Budget at Completetion (BAC) describes the total planned budget of a project or work package, and thus the total value which is to be created when completed. When re-estimations or re-scheduling is taking place, the resulting new value is called Estimate at Completion (EAC), which will be specified in detail later on in the chapter Forecasting.
The Schedule Performance Index (SPI) is the ratio of the EV divided by the PV, usually expressed as a percentage. It therefore expresses the relation between planned and actually achieved work, or in other words answers the question "How are we doing against the plan?".
| Schedule Performance Index (SPI) = Earned Value (EV) / Planned Value (PV) |
The Cost performance Index (CPI) as the ratio between the earned value and the actual cost represents an indicator for the cost effectiveness of the work accomplished.
| Cost Performance Index (CPI) = Earned Value (EV) / Actual Cost (AC) |
[edit] Requirements and process of preparation
In order to successfully execute an Earned Value Analysis, the following systematic preconditions and requirements must be fulfilled[3].
1) Time-based schedule
The measurement of progress is made on the basis of a work schedule, which must be defined and agreed, including a clear timeline and an estimation of time required per individual activity (s. Figure 4).
2) Work Breakdown Structure
All tasks and their specific scope must be defined separately in the form of a work breakdown structure, which is the basis for performing an EVA. It provides a multi-level structure for analyzing the project at varying degrees of detail[4]. Generally it is a hierarchical structure, in which each lower level represents a split into a single component from the level above. Therefore, it as well serves to control the progress of major working steps through tracking the individual activities it consists of, as for the exact allocation of cost which follows afterwards. It is the responsibility of management authority to ensure, that each individual activity within the WBS is discrete and manageable[5].
3) Cost Assessment

A cost collection system including an appropriate association of cost estimates must be implemented and executed in order to provide exact estimates of the effort of a certain activity (s. Figure 4). Whereas some activities are directly linked to the consumption of materials, usage of machines, purchases of products and services or travels, the most valuable cost commodity is probably time. Tracking the labour time it takes to fulfill a certain work package represents a major task within assessing it’s cost. Therefore, a direct link to the schedule is given at this point, often leading to a re-assessment of the schedule made[5]. The cost can then be cumulated, often generating the traditional S-curve of the project plan. By doing so continuously in the course of the working process, the actual cost, as well as the cost for given time periods, e.g. per week/month can be obtained.
4) Progress measurement
An objective, consistent, quantitative method of assessing progress is required. Whereas certain activities can be measured easily, using e.g. the meters of track layed of a certain road or cubic meters of concrete poured compared to the total, other activities require the definition „earning rules“ to evaluate how much of the work is accomplished[5]. By defining mid-activity milestones and the percentage share of the total, which can be verified easily, this can be achieved, e.g. completion of the preliminary research (10%), the first draft of a drawing (30%), it’s review and the second draft (70%) as well as finalization (90%) and approval by client (100%). These mid-milestones should furthermore be supported by evidence as the issue of documents, minutes of meeting, memos or reports.
5) Responsibility/ authority matrix
A definition of responsibilities and authorities, is key to the success of an EVA. On the one hand, each task within the WBS must clearly be linked to a responsible team member who is in charge of execution and reporting of progress. When it comes to delays or other changes in project parameters, these must be communicated and approved by the respective authorities in order to take suitable countermeasures supported by all stakeholders.
6) Monitoring and review process
In order to identify changes in the course of the project, a monitoring process of all variables must be implemented. The system used must be appropriate to the organization, and furthermore agreed by all participants and parties involved in the project. Within this reviewing process, critical steps and constraints of scope, schedule and cost must be carefully controlled. Any changes in these are to be identified, approved and then recorded through updating the anticipated values against the performance baseline. In this respect, an adequate reporting system should be created to facilitate the information exchange.
[edit] Areas of application
[edit] Organizational level - Earned Value Management System (EVMS)
Fulfilling the requirements for an EVA stated above represent a challenge for organizations, but at the same time, when executed systematically, it can lead to an overall growth of maturity and transparency throughout the entire value chain[1]. Therefore, these measures can be embedded in an Earned value management System (EVMS), using a dedicated process, procedures, tools and templates.
The Electronic Industries Alliance (EIA) has release a standard regarding EVMS which contains a set of 32 Guidelines, defines the requirements that an Earned Value Management System (EVMS) must meet. These guidelines represent a management approach on organizational level, that once incorporated on any type of program, whether research and development, construction, production, etc. provides all levels of management with an insight into cost, schedule and scoping issues. It addresses EVMS in 5 different dimensions[6][7]:
- Organization
- Coordinate all departments involved in the project tasks
- Definition of their strategic relationship to product deliverables
- Identification of who is responsible (Organization breakdown structure, OBS)
- Planning, Scheduling and Budgeting
- Budgeting and resource allocation system
- Project Road-map and planning instances
- Overall risk management
- Accounting Considerations
- Capturing all actual cost
- Consistent with the way the work is performed
- Correct time-allocation
- EVMS Analysis and EVMS Management Reports
- Summarize and analyze data
- Documenting cause, impact, and correction action
- Determining new estimates
- Revisions and Data Maintenance
- Disciplined and timely incorporation of customer directed changes
- Internal replanning and baseline control
In this way, the EVMS aims at the main objectives of Earned Value Management in general. It includes to keep supervisors/managers regularly informed about the status and true cost situation of "their" part of a project. This shall be done across all hierarchical levels. Furthermore, it is to ensure that the project definition is complete. All activities and required resources used for different projects must be managed without exception. Additionally, the Involvement of all the project engineers in the process serves the purpose of drawing their attention to existing financial constraints. An increased cost consciousness is established and enforces an efficiency-culture in the organization [8].
[edit] Project controlling
As pointed out earlier, the EVA method perfectly serves the purpose of controlling entire projects. Using the Work Breakdown Structure in order to monitor the elements of work at the required level of detail, the Earned Value (EV) can be assessed and measured against the Planned Value (PV). This can either be done by simply allocating a proportion of the total PV to each activity, or by predicting the time, materials and other cost factors related to it. Using the agreed project schedule, the cumulated PV and Actual Cost (AC) over time can then be used in the following calculations to measure performance on the project.
Example:
The creation of a drawing for a design project consists of 6 different activities. Now that the monthly reporting to the management is to be prepared, an assessment of the current progress of the project (at this specific point of time) is made using EVA. The following values have been determined:
| Activity | BAC | Planned Value | Completion (%) | Earned Value | Actual Cost | Schedule Variance | Cost Variance |
|---|---|---|---|---|---|---|---|
| 1 | 80€ | 80€ | 100 | 80€ | 60€ | 0 | +20 |
| 2 | 80€ | 80€ | 100 | 80€ | 100€ | 0 | -20 |
| 3 | 100€ | 100€ | 100 | 100€ | 90€ | 0 | +10 |
| 4 | 100€ | 100€ | 50 | 50€ | 60€ | +50 | -10 |
| 5 | 150€ | 100€ | 33 | 50€ | 70€ | -50 | -20 |
| 6 | 150€ | 0 € | 33 | 50€ | 50€ | +50 | 0 |
| Total | 660 | 460 | 410 | 430 |
Table 1: Exemplary assessment of EVA data
As defined earlier, the budget at completion (BAC) defines the value which is to be created by the individual activity when finished whereas the PV is the budgeted value which, according to the plan, is to be accomplished at that specific point of time. In the example activity 5 should be started but not be completed entirely at this point of time, whereas activity 6 hasn't been started at all according to plan. The calculation for activity 5 are exemplarily calculated as follows:
Earned Value: EV(5) = PV x Progress (%) = 150€ x 33% = 50€
Schedule Variance: SV(5) = EV - PV = 50€ - 100€ = -50€
Cost Variance: CV(5) = EV - AC = 50€ - 70€ = -20€
This shows that on the one hand, activity 5, having created 33% of its' total value, is behind schedule by - 50€ as indicates the SV. In other words, the output is not as high as it should be according to schedule. On the other hand, the cost variance (CV) indicates that the input is 20€ higher than planned with actual costs of 70€ compared to 50€ value created.
Generally, the analysis reveals that activities 4 and 5 are in fact the ‘problem activities’. Both are behind schedule and over cost. It is also noted from the table that activity 1 was completed under the original budgeted cost but activity 2 was over budget. According to the data collected, Activity 6 is ahead of schedule and on cost.
The overall negative impression is confirmed by taking into account the following overall project KPIs:
Schedule Performance Index (SPI) = 410€ / 480€ = 0,89
Cost performance Index (CPI) = 410€ / 430€ = 0,95
The SPI < 1 indicates that the project is clearly delayed significantly, whereas the CPI < 1 reveals an unfavorable situation in terms of cost efficiency.
Kedi and Hongping (2010) furthermore provide guidance for an interpretation for the SPI, including recommended actions (s. Table 2)
| SPI Value Range | Interpretation | Corrective action |
|---|---|---|
| >1,0 | progress is ahead the schedule | - |
| <1,0 | progress is behind the schedule | s.b. |
| 0.9< SPI <1.0 | delay within normal range | adjustment of schedule not required |
| 0.8< SPI <0.9 | slight delay | adjustment of schedule not required, Increase use existing resources, Adding additional resources to be considered |
| 0,7 <SPI <0.8 | considerable delay, causing the risk to not finish the work | adjust schedule, additional resources needed |
| SPI <0.7 | critical delay, high risk for the project | re-schedule, re-estimate planned resources, solve source of delay using additional management reserves |
| SPI >1.3 | significant advance in the progress of the project | check for errors in assessment of workload, re-schedule plan, re-estimate resources |
Table 2: Interpretation of SPI[9]
[edit] Forecasting
It is one of the main tasks of a project manager to control the overall tendency of a project and to evaluate, whether a certain delay or increase of cost will be critical for its' outcome or not. Since a quantification of the delay and cost overrun is key to inform project-related stakeholders and to choose the right countermeasures, forecasting time and cost of in a project are very important. Figure 5 shows a case, in which the AC clearly exceed the PV (BCWP), leading to an increased EAC.
Generally, the calculations made in EVA and the frequent review of the underlaying values can be used for the forecasts of the anticipated project completion and the cost at completion, as well their expected variance[1]:

- Cost estimate at completion (CEAC)
- Cost variance at completion (CVAC)
- Time estimate at completion (TEAC)
- Time variance at completion (TVAC)
In order to calculate the cost estimates at completion, the work remaining is added to cumulated actual cost, considering the cost effectiveness which has been achieved in the course of the project so far through the CPI:

The actual cost and progress of the remaining tasks should be estimated every week, which can determine the progress of the project future trends.
Using the CEAC, the predicted variance at project completion CVAC [9] can easily be calculated as

Example:
Using the example project from the previous chapter, the unfavorable cost efficiency (CPI=0,95) will lead to an increased estimated cost of completion, which can be calculated as follows:
CEAC = AC + ((BAC-EV) / CPI)
= 430€ + (660€ - 410€) / 0,95
= 430€ + 263,16€
= 693,16€, resulting in an overall CVAC of
CVAC = BAC - CEAC
= 660€ - 693,16€
= - 33,16'€
indicating that the total cost at the end of activity 6 will probably be 33,16€ higher than originally planned.
The time estimated at completion (TEAC) can be determined using the renewed agent on the basis regular reviews. The revised completion date can be adjusted through the evaluation of the following factors:
- Schedule Performance Index (SPI).
- Anticipated staffing changes.
- Individuals questions and risks identified in regular project reviews
Afterwards, the TVAC can be calculated as the difference between originally planned finishing schedule and TEAC[9].
[edit] Key benefits
As pointed out earlier, the EVA method requires a number of systematic characteristics within in organization in order to be applied successfully. Therefore, an overall benefit of the method is, that is provides a framework for organizations to improve their overall process quality and information provision structure[2]. Besides benefiting from the results of the EVA itself, the overall learning effect which necessarily takes place during the process of implementation includes
- Increased information supply across different hierarchies [8]
- Systematical ensured overall completion of budgeting and resource allocation [8]
- increased cost awareness throughout the organization
The main, direct benefits of EVA as an assessment method of progress are the following:
- Uniform measure of progress (in time or money) and therefore allows to make simple measurements in complex situations [5]
- Comparability of progress in different areas of work on a consistent basis (e.g. across sub-projects) [5]
- Risk mitigation and management due to regular reviews and overall, tangible performance measurement regarding project scope, schedule, and budget [10]
- Facilitates decision making and performance improvement
- Enables project managers to provide estimation of overall project outcome through forecasting
[edit] Limitations and pitfalls
With reference to the benefits stated above, the point "organizational readiness" can at the same time represent the main obstacle for companies to implement Earned Value Analysis as a tool. The major requirement to establish a complete and detailed WBS and underpin the resulting plan with cost- and budget data on a regular basis, which is hard to achieve in an organization which doesn't have in place the required information infrastructure[4]. This means the ability to gather and process schedule, cost and budget metrics, e.g. the effort it takes to determine and quantify the real progress made or the actual cost of a project, including those cost that have been caused but for which no invoice has been received [9].
Additionally, Lukas (2008) points out several reasons which in reality lead to failure of EVA[2]:
- the requirements are not defined or incomplete;
- the WBS is not used, not accepted or incomplete;
- the project plan is not integrated (not reflecting in WBS-Schedule-Budget);
- the schedule and/or budget are planned incorrectly;
- the change management is not used or used ineffective;
- the cost collection system is inadequate;
- the progress not measured correctly
Furthermore, he states that a major limitation is that an SPI > 1.0 does not necessarily indicate that a project is ahead of schedule. The reason is that accomplishing more work than planned by working on non-critical path work packages might still indicate a higher EV. Accordingly, this requires to look at project float to determine whether you are ahead, on or behind schedule. This points into the direction of another limitation, stated by Raby (2000), saying that EVA provides variances, but it does not indicate the cause and the effect on the critical path of the project [5]. This is underpinned by the investigation of Howes (2000), who in his work identifies the major weakness of EVA, not taking into account the sequence of work packages, which has been created through network analysis. Instead, the violation of the project plan is described using overall project cost and thus lacks a level of detail and concreteness in terms of the individual activities significance. [4]
[edit] References
- ↑ 1.0 1.1 1.2 1.3 Baldwin, Andrew and Bordoli, David (2014) A Handbook for Construction Planning and Scheduling, Chapter 6, p.158, First Edition, Jonn Wiley & Sons
- ↑ 2.0 2.1 2.2 Lukas, Joseph (2008) Earned Value Analysis – Why it Doesn't Work, AACE INTERNATIONAL TRANSACTIONS
- ↑ Raf Dua (1999) Implementing Best Practice in Hospital Project Management Utilising EVPM methodology
- ↑ 4.0 4.1 4.2 Howes, R., (2000),"Improving the performance of Earned Value Analysis as a construction project management tool", Engineering, Construction and Architectural Management, Vol. 7 Iss 4 pp. 399 - 411
- ↑ 5.0 5.1 5.2 5.3 5.4 5.5 Michael Raby, (2000),Project management via earned value, Work Study, Vol. 49 Iss 1 pp. 6 - 10
- ↑ National Defense Industrial Association, Integrated Program Management Division (2014), EIA-748-EVMS Standard, Revision C Intent Guide, p. 4-51
- ↑ Howard Hunter, Richard Fitzgerald, Dewey Barlow (2014), Improved cost monitoring and control through the Earned Value Management System, Acta Astronautica 93, p. 497-500
- ↑ 8.0 8.1 8.2 Ferguson, J., Kissler, K.H. (2002), Earned Value Management, p.2
- ↑ 9.0 9.1 9.2 9.3 9.4 Kedi, Zhu and Hongping, Yang (2010), Application of Earned Value Analysis in Project Monitoring and control of CMMI, 3rd International Conference on Advanced Computer Theory and Engineering (ICACTE)
- ↑ Hayes, Heather (2002) Using Earned-Value Analysis to Better Manage Projects, Pharmaceutical Technology, Feb 2002., p.80
[edit] Annotated bibliography
Baldwin, Andrew and Bordoli, David (2014) A Handbook for Construction Planning and Scheduling: This chapter of the handbook explains the basis of the technique and the EVA methodology. It outlines what is needed for an EVA system and how to use it successfully, identifying common pitfalls and how to overcome them in the context of construction activities, providing very helpful examples and graphs.
Lukas, Joseph (2008) Earned Value Analysis – Why it Doesn't Work: Lukas provides a differentiates view on EVA from a practical point of view. In his article, he very critically reflects upon EVA, outline the design of the method and its' intentional application, but then very strictly works out the limitations and issues one has when using EVA in reality. As the title suggest, his position towards EVA is rather negative.
Raf Dua (1999) Implementing Best Practice in Hospital Project Management Utilising EVPM methodology: Dua applies EVA in the context of Earned Value Performance Management (EVPM) within the optimization of risk management and process control in hospital project management. His motivation is that healthcare sector usually does not face the competitive pressure as other industries. He therefore works out and describes extensively the EVM methodology and the implementation requirements in order introduce these to hospital sector, providing a case study and special research in that area.
Howes, R. (2000) Improving the performance of Earned Value Analysis as a construction project management tool: Howes, similar to Lukas stated above, takes a rather critical position towards EVA. In his paper, he attempts to refine and improve the performance of traditional EVA by the introduction of a hybrid methodology based on work packages and logical time analysis entitled Work Package Methodology (WPM). In a nutshell, he in his approach applies EVA calculations to individual work packages in order to take into consideration their unique characteristics.
Michael Raby (2000), Project management via earned value: This article very clearly outlines the main characteristics of EVA and the benefits of its' application in project management. While doing so in a nicely summarized way, he provides a quick introduction and a step-by-step guide for execution of the method.
National Defense Industrial Association, Integrated Program Management Division (2014), EIA-748-EVMS Standard, Revision C Intent Guide: This intent guide describes the main requirements within the EIA standard for EVMS and the 32 key consideration to be included. The very specific instructions are summarized, clustered in 5 dimensions and their overall relevance for businesses is explained.
Howard Hunter, Richard Fitzgerald, Dewey Barlow (2014), Improved cost monitoring and control through the Earned Value Management System: This article introduces EVMS in order to optimize performance measurement in Space Department. In order to provide a consistent, standard framework for assessing project performance, which has already been implemented in a reference project, the key characteristics are summarized nicely before the article very specifically treat the particularities of the case study.
Ferguson, J., Kissler, K.H. (2002), Earned Value Management: A very quick but convenient introduction to the EVM requirements, objectives, followed by a general application in the contracting environment of the european institute for nuclear research (CERN).
Kedi, Zhu and Hongping, Yang (2010), Application of Earned Value Analysis in Project Monitoring and control of CMMI: This article reflects upon EVA as a software project controlling method in the context of the CMMI maturity model. They provide detailed schemes for interpretation of EVA indicators. Furthermore, the methods applicability is linked to the overall capabilities of an organization to provide cost, schedule and budget metrics.
Hayes, Heather (2002) Using Earned-Value Analysis to Better Manage Projects: A short introduction to the benefits of EVA, followed by a description of it's relevance for pharmaceutical sector according to a generic example.