Earned Value Analysis
In order to measure performance in terms of cost, time and work progress, the Earned Value Analysis (EVA) is introduced as a suitable method, offering quantitative analysis techniques as well as objective performance indicators [1].Besides giving an overview of the method itself and the steps, which must be followed in order to carry out an EVA, the requirements on both structural and methodological level are presented and the key benefits are outlined. In addition to its’ primary area of application as a tool within project controlling, the extended usability of the method in other key functions of a company is shown. All technical contents are being demonstrated based on illustrative examples.
Contents |
Definition
The Earned Value Analysis is defined as a quantitative technique of performance measurement, using estimates of both work progress and related cost to determine the overall efficiency of a respective activity, work package or project[1]. In order to do so, it compares the scope of the project, the schedule of work and the work undertaken in order to determine the status, the likely completion and the out-turn cost of the observed object.
The basic values, which are used in this calculation are the following[2]:
The Planned Cost (PC) are the budgeted cost of the work, which must be completed according to a specified schedule. It is therefore also referred to as the Budgeted Cost of Work Scheduled (BCWS) or as Planned Value (PV) and includes all labour, material, and other cost which is related to specific working steps.
The Actual Cost (AC) describe the cost of the work which has already been accomplished and can also be called the Actual Cost of Work Performed (ACWP)
The Earned Value (EV), also called the Budgeted Cost of Work Performed (BCWP) is an indicator for the value of the work accomplished. It can be determined by calculating the percentage of the total budget which is actually completed at that specific point of time:

These values then serve to calculate additional indicators, which describe how the actual values deviate from the planned values and thus provide important information on how the project is doing:
The Cost Variance (CV) is the algebraic difference between the earned value and the actual cost:

A positive value indicates a favourable condition. A negative value indicates an unfavourable condition. The cost variance may be expressed as a value for a specific period or as a cumulative value to date.
The Schedule Variance (SV) is a metric for the schedule performance derived from EV metrics and, as the algebraic difference between earned value and planned value, indicates if the progress is on schedule.

The Schedule Performance Index (SPI) is the ratio of the EV divided by the PV (usually expressed as a percentage)

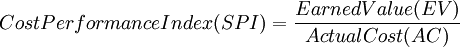
The Cost performance Index (CPI) as the ratio between the earned value and the actual cost represents an indicator for the cost effectiveness of the work accomplished.
| Earned Value (EV) = Total Budget x Work Progress |
| Cost Variance (CV) = Earned Value (EV) - Actual Cost (AC) |
| Schedule Variance SV = Earned Value (EV) - Planned Value (PV) |
| Schedule Performance Index (SPI) = Earned Value (EV) / Planned Value (PV) |
| Cost Performance Index (SPI) = Earned Value (EV) / Actual Cost (AC) |
Requirements
In order to successfully execute an Earned Value Analysis, the following systematic preconditions and requirements must be fulfilled[3]
1) Time-based schedule
The measurement of progress is made on the basis of a work schedule, which must be defined and agreed, including a clear timeline and an estimation of time required per individual activity.
2) Work Breakdown Structure
All tasks and their specific scope must be defined separately in the form of a work breakdown structure, which provides a multi-level structure for analyzing the project at varying degrees of detail (Link zum WBS article) It is generally a hierarchical structure, in which each lower level into a single component at the level above. Therefore, it as well serves to control the progress of major working steps through tracking the individual activities it consists of, as for the exact allocation of cost which follows afterwards. It is the responsibility of management authority to ensure, that each individual activity within the WBS is discrete and manageable[4].
3) Cost Assessment
A cost collection system including an appropriate association of cost estimates must be implemented and executed in order to provide exact estimates of the effort of a certain activity. Whereas some activities are directly linked to the consumption of materials, usage of machines, purchases of products and services or travels, the most valuable cost commodity is probably time. Tracking the labour time it takes to fulfill a certain work package represents a major task within assessing it’s cost. Therefore, a direct link to the schedule is given at this point, often leading to a re-assessment of the schedule made[4]. The cost can then be cumulated, generating the traditional S-curve of the project plan. By doing to continuously in the course of the working process, the actual cost, as well as the cost for given time periods, e.g. per week/month can be obtained.
4) Progress measurement
An objective, consistent, quantitative method of assessing progress is required. Whereas certain activities can be measured easily, using e.g. the meters of track layed of a certain road or cubic meters of concrete poured compared to the total, other activities require the definition „earning rules“ to evaluate how much of the work is accomplished[4]. By defining mid-activity milestones and the percentage share of the total, which can be verified easily, this can be achieved, e.g. completion of the preliminary research (10%), the first draft of a drawing (30%), it’s review and the second draft (70%) as well as finalization (90%) and approval by client (100%). These mid-milestones should furthermore be supported by evidence as the issue of documents, minutes of meeting, memos or reports.
5) Responsibility/ authority matrix
A definition of responsibilities and authorities, is key to the success of an EVA. On the one hand, each task within the WBS must clearly be linked to a responsible team member who is in charge of execution and reporting of progress. When it comes to delays or other changes in project parameters, these must be communicated and approved by the respective authorities in order to take suitable countermeasures supported by all stakeholders.
6) Monitoring and review process
In order to identify changes in the course of the project, a monitoring process of all variables must be implemented. The system used must be appropriate to the organization, and furthermore agreed by all participants and parties involved in the project. Within this reviewing process, critical steps and constraints of scope, schedule and cost must be carefully controlled. Any changes in these are to be identified, approved and then recorded through updating the anticipated values against the performance baseline. In this respect, an adequate reporting system should be created to facilitate the information exchange.
Areas of application
Organizational Level - Earned value management System (EVMS)
Fulfilling the requirements for an EVA stated above represent a challenge for organizations, but at the same time, when executed systematically, it can lead to an overall growth of maturity and transparency throughout the entire value chain. Therefore, these measures can be embedded in an Earned value management System (EVMS), using a dedicated process, procedures, tools and templates.
Project Controlling
As pointed out earlier, the EVA method perfectly serves the purpose of controlling entire projects. Using the Work Breakdown Structure in order to monitor the elements of work at the required level of detail, the Planned Value (PV) can be assessed. This can either be done by simply allocating a proportion of the total PV to each activity, or by predicting the time, materials and other cost factors related to it. Using the agreed project schedule, the cumulated PV over time can then be used in the following calculations to measure performance on the project.
Figure 2 shows a typical PV curve for a project. The exact form of this curve will vary for each project depending on the activities, costs and timing of the construction work. Figure 3 includes the actual cost at the time of review of a specific project, which is above the budgeted cost (PV) and therefore should rise concerns. Figure 4 shows another scenario and additionally includes the earned value of a project, which on the contrary is ahead of schedule since the earned value exceeds the planned value, and the actual cost is even below the PV.
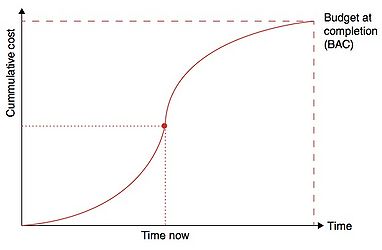
Figure 2 - Planned Value Curve
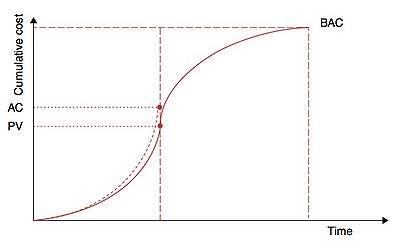
Figure 3 - Planned Value and Actual Cost (AC)
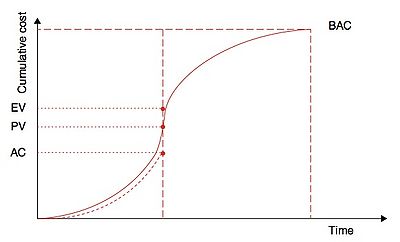
Figure 4 - Planned Value, Actual Cost and Earned Value


Example:
The creation of drawing for a design project consists of 6 different activities. Now after 4 weeks, the monthly reporting to the management is to be prepared. Therefore, an assessment of the current progress of the project is made using EVA. The following values have been determined:
| Activity | BAC | Planned Value | Completion (%) | Earned Value | Actual Cost | Schedule Variance | Cost Variance |
|---|---|---|---|---|---|---|---|
| 1 | 80€ | 80€ | 100 | 80€ | 60€ | 0 | +20 |
| 2 | 80€ | 80€ | 100 | 80€ | 100€ | 0 | -20 |
| 3 | 100€ | 100€ | 100 | 100€ | 90€ | 0 | +10 |
| 4 | 100€ | 100€ | 50 | 50€ | 60€ | +50 | -10 |
| 5 | 150€ | 100€ | 50 | 50€ | 70€ | -50 | -20 |
| 6 | 150€ | 0 € | 33 | 50€ | 50€ | +50 | 0 |
| Total | 660 | 460 | 410 | 430 |
The budget at completion (BAC) defines the value which is to be created by the individual activity. As defined earlier, the PV is the budgeted value which is planned to be accomplished after week 4, e.g. activity 5 should be started but not be completed entirely, whereas activity 6 at this point of time is not planned to be started at all. The calculation for activity 5 are exemplarily calculated as follows:
Earned Value: EV(5) = PV x Progress (%) = 150€ x 50% = 75€
Schedule Variance: SV(5) = EV - PV = 50€ - 100€ = -50€
Cost Variance: CV(5) = EV - AC = 50€ - 70€ = -20€
Generally, the analysis reveals that activities 4 and 5 are in fact the ‘problem activities’. Both are behind schedule and over cost. It is also noted from the table that activity 1 was completed under the original budgeted cost but activity 2 was over budget. According to the data collected, Activity 6 is ahead of schedule and on cost.
Schedule Performance Index (SPI) = 410€ / 480€ = 0,89
Cost performance Index (CPI) = 410€ / 430€ = 0,95
The SPI < 1 indicates that the project is clearly delayed significantly, whereas the CPI < 1 reveals an unfavorable situation in terms of cost efficiency.
Kedi and Hongping (2010) furthermore provide guidance for an interpretation for the SPI ("How are we doing against the plan?") and of CPI (‘Are we efficient?’), including recommended actions (s. Table 1)
| SPI Value Range | Interpretation | Corrective action |
|---|---|---|
| >1,0 | style="width: 15em"| - | |
| <1,0 | style="width: 15em"| s.b. | |
| 0.9< SPI <1.0 | style="width: 15em"| adjustment of schedule not required | |
| 0.8< SPI <0.9 | style="width: 15em"|adjustment of schedule not required, use existing resources, extra resources to be considered | |
| SPI <0.7 | style="width: 15em"| | |
| SPI >1.3 | style="width: 15em"| |
Forecasting
Key Benefits
Uniform measure (time or money) and therefore allows us to make simple measurements in complex situations (Ruby, 2000)
Comparability of progress in different areas of work on a consistent basis
Risk mitigation and management
Facilitates decision making and performance improvement Provides clear KPIs: - SPI (How good are doing against the plan?) - CPI (Are we efficient?)
Limitations
SPI > 1.0 does not necessarily mean you are ahead of schedule You can accomplish more work than planned by working on non-critical path work packages. You need to look at project float to determine whether you are ahead, on or behind schedule. (Lukas 2008)
References
- ↑ 1.0 1.1 Baldwin, Andrew and Bordoli, David (2014) A Handbook for Construction Planning and Scheduling, Chapter 6, p.158, First Edition, Jonn Wiley & Sons
- ↑ Lukas, Joseph (2008) Earned Value Analysis – Why it Doesn't Work, AACE INTERNATIONAL TRANSACTIONS
- ↑ Raf Dua (1999) Implementing Best Practice in Hospital Project Management Utilising EVPM methodology
- ↑ 4.0 4.1 4.2 Michael Raby, (2000),Project management via earned value, Work Study, Vol. 49 Iss 1 pp. 6 - 10