Earned Value Management
Earned Value Management (EVM) is a method for measuring a project’s performance. Earned Value Management is a complex task of controlling and adjusting the baseline project schedule during execution, taking into account project scope, timed delivery and total project budget. The method is useful during execution of a project because it tells us where we are going with schedule and costs, indicating any variance to plan.
Contents |
Introduction
An important part of successful project management is to have accurate and reliable information and the current performance is the best indicator of future performance. By using trend data, it is therefore possible to forecast cost and schedule overruns early in the project.
Background
The Earned Value Management method was introduced in the 1960s as a financial analysis specialty in United States Government programs, but has since been a significant branch of project management. In the late 1980s and early 1990s, it was no longer used by EVM specialists only. The EVM was emerged as a project management methodology to be understood and used by managers and executives also, and today EVM has become an essential part of every project tracking.
The method can be used to measure the real progress of a project, and combines the measurements of the project management triangle: scope, time and cost. Thereby the EVM method provides early indications of expected project results based on project performance and highlights the possible need for corrective action. These indications become available to management as early as 20 percent into the project [1].
The EVM Method
With the EVM method we can measure the expected total project time and cost and calculate the deviation between the current performance and the planned performance. The method uses some basic EVM metrics, which will be introduced.
The Metrics

EVM uses three key parameters to measure project performance [2].:
- Planned value (PV) or Budgeted Cost of Work Scheduled (BCWS)
- This is the time-phased budget baseline. It is the approved budget for accomplishing the activity or work related to the schedule. PV can be viewed as the value to be earned as a function of project work accomplishments up to a given point in time. The total PV is equal to the Budget at Completion (BAC). This is the total budget baseline for the activity or work package. It is the highest value of PV and the last point on the cumulative PV curve. The graph of cumulative PV is often referred to as the S-curve, because it (almost) looks like the letter S.
- Actual Cost (AC) or Actual Cost of Work Performed (ACWP)
- This is the cumulative actual cost spent to a given point in time to accomplish an activity or work (and to earn the related value).
- Earned Value (EV) or Budgeted Cost of Work Performed (BCWP)
- This is the cumulative earned value for the work completed up to a point in time. It represents the amount budgeted for performing the work that was accomplished by a given point in time. The EV equals the total budget at completion (BAC) multiplied by the percentage activity (or project) completion (PC) at the particular point in time

Example
A project has a total budget at completion (BAC) of $100.000. Then a Work Breakdown Structure (WBS) can be used to break down the different activities. A work package 1.1 has a budget of $20.000 and is 100% complete as of the status date. Thereby, the Earned Value for this work package is:

Work Package 1.2 has a budget of $40.000 and is 50% complete, and the Earned Value is:

The Earned Value for the entire project is:


The planned value as of the status date is PV = $50.000, but the actual cost is AC = $60.000 and the earned value is EV = $40.000. This means that the project is over budget and delayed, which can be seen on Figure 2.

Performance Measurements
By comparing the three key parameters, PV, AC and EV, it is possible to determine the cost performance and schedule performance. The variances are based on cumulative data (also called inception-to-date data and project-to-date data).
Variances

- The Cost Variance (CV) is the difference between the earned value (EV) and the actual cost (AC), i.e. a measure of budgetary conformance of actual cost of work performed. In other word, CV indicates how much over or under budget the project is.

- The Schedule Variance (SV) is the difference between the earned value (EV) and the planned value (PV), i.e. a measure of the conformance of actual progress to the schedule. So in other words, SV indicates how much ahead or behind schedule a project is running.

Example
If we go back to the example mentioned above, we can calculate the cost variance and the schedule variance.


Performance Indices
The performance indices are ratios, which say something about the efficiency.
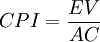
- The Cost Performance Index (CPI) is the ratio of earned value (EV) to the actual cost (AC), i.e. a measure of budgetary conformance of actual cost of work performed.
- The Schedule Performance Index (SPI) is the ratio of earned value (EV) to the planned value (PV), i.e. a measure of the conformance of actual progress to the schedule. The SPI provides information about schedule performance of the project. It is the efficiency of the time utilized on the project.

- The product of the Cost Performance Index (CPI) and the Schedule Performance Index (SPI) is called the cost-schedule index, or the Critical Ratio (CR). This ratio is an indicator of the overall project health, and it informs you of how much you are getting out of each dollar spent on the project.

A ratio equal 1.0 indicates that performance is efficient and on target. A ratio greater than 1.0 indicates excellent, highly efficient performance. A ratio less than 1.0 indicates poor, inefficient performance.
Example
If we need to find the cost performance index (CPI) and the schedule performance index (SPI) for the above project, we can calculate it by:
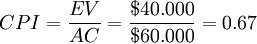
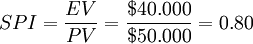
From theses indices we see that both the CPI and SPI are less than 1.0, which indicates that we are a little behind schedule and a lot over budget.
Forecasting
It is said that bad news known at the 20% point in a project’s life cycle gives an opportunity to take corrective actions [3]
Cite error:
<ref> tags exist, but no <references/> tag was found