Earned Value Management (EVM) in construction projects
Thorgeir11 (Talk | contribs) (→Example) |
Thorgeir11 (Talk | contribs) |
||
| Line 164: | Line 164: | ||
His report at the end of week 7 can be seen in table 2. | His report at the end of week 7 can be seen in table 2. | ||
| − | According to the report | + | Using the data from that table to fill up the ''GANTT Chart''. According to the report and from the ''GANT Chart'' it can be concluded that task '''C''' and '''D''' are behind schedule. |
| + | {| class="wikitable" style="text-align:left;" | ||
| + | |- style="vertical-align:top;" | ||
| + | ! Earned Value Variances | ||
| + | ! Description | ||
| + | ! Formula | ||
| + | !BLAA | ||
| + | |- | ||
| + | |- style="vertical-align:top;" | ||
| + | | '''Cost Variance (CV)''' | ||
| + | |o | ||
| + | |} | ||
[[File:2.png|500px|thumb|right|'''Figure 1:''' Tasks.]] | [[File:2.png|500px|thumb|right|'''Figure 1:''' Tasks.]] | ||
Revision as of 09:49, 15 September 2016
The Us federal government introduced Earned Value management(EVM) in 1967 as a part of the cost/schedule control systems criteria (C/SCSC) Earned Value management is a systematic process that is used to measure the performance of a project at different times throughout the life cycle of a project. EVM is useful to help project managers or people in general that are responsible for a project to determine whether a project is on schedule, or if the project is over or under budget. EVM can also be used to compare the actual work that has been performed to the work that was estimated and planned for the project at a certain time during the project, EVM can also be used to forecast projected performance. EVM is a technique that can be applied, to at least some degree, to the management of projects in any industry and using any contracting approach. The use of EVM requires
Contents |
History
Concept overview
Implementation of the method
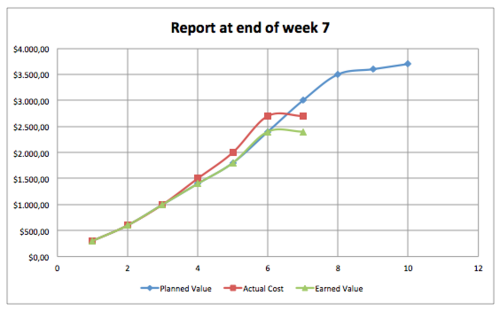
The following parameters are used to asses and compare in EVM Planned value (PV) Is a budget baseline that has been established for a project/work package/activity. It is a function of cost and time as can be seen in figure 1. PV baseline can be used to view the value to be earned at a certain time/phase in the project. PV is frequently referred to as the S curve simply because of the shape of the curve Budget at completion (BAC) BAC is the final point and the highest value of the cumulative Planned value curve. BAC represents the total budget for the project/work package/activity. Actual Cost (AC) Is the cumulative actual cost that has been spent on a project/work package/activity Earned value (EV) is the cumulative value that has been earned for the work completed at a certain point in time. To obtain the earned value for an item the following formula can be used with a simple example: A certain project has a total budget of 100 DKK, the project is 30% done than the EV is the following Earned value(EV)=total budget for activity*completed proportion
Earned value(EV)=100 DKK*30%=30 DKK This formula translates project accomplishments from physical units of measure, e.g. milestones completed, kilometers of tarmac for highway, amount of floors completed in a house and converts them into measurable financial units.
| Parameter | Description | Formula | BLAA |
|---|---|---|---|
| Planned Value (PV) | Is a budget baseline that has been established for a project/work package/activity. It is a function of cost and time as can be seen in figure 1. PV baseline can be used to view the value to be earned at a certain time/phase in the project. PV is frequently referred to as the S curve simply because of the shape of the curve | o | |
| Budget at completion (BAC) | |||
| Actual Cost (AC) | Is the cumulative actual cost that has been spent on a project/work package/activity | ||
| Earned value (EV) | is the cumulative value that has been earned for the work completed at a certain point in time. | Earned value(EV)=total budget for activity*completed proportion |
| Earned Value Variances | Description | Formula | BLAA |
|---|---|---|---|
| Cost Variance (CV) | o | = Earned Value (EV) - Actual Cost (AC) | > 0 means under budget
< 0 means over budget |
| Schedule Variance (SV) | o | = Earned Value (EV) - Planned Value (PV) | > 0 means ahead of schedule
< 0 means behind schedule |
| Earned Value Indices | Description | Formula | BLAA |
|---|---|---|---|
| Cost Performance Index (CPI) | o | = EV/AC | > 1 means better progress for the money spent
< 1 means less progress for the money spent |
| Schedule Performance Index (SPI) | o | = EV/PV | > 1 means more work performed than had been scheduled
< 1 means less work performed than had been scheduled |
| Project Percent Complete | o | = (EV/BAC) * 100 | Percent of project work complete at a given time.
Remember BAC = Budget at Completion |
| To Complete Performance Index (TCPI) | o | =(BAC-EV)/(BAC-AC) | The cost performance index required to complete the project on the predetermined budget. |
| Earned Value Forecast | Description | Formula | BLAA |
|---|---|---|---|
| Estimate at completion (EAC) | o | = BAC/CPI | The estimated total cost at project completion. |
| Variance at completion (VAC) | o | = BAC-EAC | The estimated variance between actual total cost(EAC) and planned total cost(BAC) at project completion. |
Terminology
Example
In this section there will be an short simplified example of EVM in a project that has five tasks A,B,C,D,E. Figure 1. Step 1 For each of the tasks the duration has been estimated, the cost of each task per week and finally the total cost of each task. These cost are called Planned value(PV) in EVM. In more detailed examples and projects a Work Breakdown schedule"(WBS) can be very useful if used in the right ways.
To keep track of the status of each of the projects a Gantt Chartt has proven to be very useful since it provides much needed clarity, helps with coordination and last but not least time management, helping teams understand the overall impact of project delays which is an vital part of the EVM method. In this Gantt chart there can be seen the planned schedule and the actual performance of the project up until week 7 when the project manager decided to take a closer look at the progression of the project.
His report at the end of week 7 can be seen in table 2. Using the data from that table to fill up the GANTT Chart. According to the report and from the GANT Chart it can be concluded that task C and D are behind schedule.
| Earned Value Variances | Description | Formula | BLAA |
|---|---|---|---|
| Cost Variance (CV) | o |
Advantages
The use of EVM to make progress payments on construction projects.
When undergoing a project there is often a risk that the owner of the project is going to overpay their suppliers for the work they completed. This is due to the fact that Cost-type arrangements have inherent risk for the sake of the owners focusing on the expense paid and forgetting to closely monitor the actual work done for the money spent. One way of mitigating this risk is to accurately measure the value of work completed, compare that against the original budget authorized for the completed work, and only pay for actual work completed.


