Earned Value Management - EVM
Contents |
Abstract
Earned Value Management is a very powerful and popular project monitoring tool. Monitoring and controlling are key practices in project management, serving the purpose of informing the project managers on the advancement of the project. They take as inputs the results of the planning process and investigate if the plans are being implemented in an anticipated way. In this context, Earned Value Management is mainly used in highly complex environments like construction and infrastructure and allows for a combination of time and cost controlling (ISO 21500), therefore guaranteeing a more holistic overview of the project advancement than other monitoring tools.
This paper will firstly provide a description of the tool and its purpose including formulas and essential vocabulary. Then, it will provide a framework on how to apply this method. Lastly, it will look into its limitations, and explore the reasons why it is mainly used in very complex projects and environments [1]
How to do Earned Value Management

“How is your project going?” is a very frequently asked question to project managers and one it’s not easy to answer. As pointed out by Lukas, Joseph A. [2] one of the techniques that are frequently in project management is comparing the planned expenditure curve with the actual one. However, this approach can cause major errors and provide misleading information. As projects are complex processes that involve a large number of aspects and dimensions, controlling just one of these dimensions is reductive. For example, in this case, it is not clear if the work is being accomplished with less money than anticipated, or if the project is behind schedule. The scope of earned value management is to provide a bi-dimensional tool, that is able to plot both the time and cost dimension of the project, therefore providing a more holistic monitoring tool that in one single graph contains a large amount of information on the project.
Terminology
As pointed out by Lukas, Joseph A. [2] it is important to clarify the terminology associated with Earned Value, as it is a source of confusion for many:
- Earned Value Analysis (EVA) — It is a quantitative method of assessing the progress of a project at any given point in time, predicting its completion date and final cost, and evaluating cost and schedule variances as the project progresses. Its objective is to assess whether the cost, schedule, and work done are progressing in accordance with the plan, comparing the expected amount of work done with what has actually been achieved. (Earned Value Analysis by Scott W. Cullen)
- Earned Value Management (EVM) is a project management methodology that uses an integrated schedule and budget approach and is based on a WBS to objectively evaluate project performance.
- Earned Value Management System (EVMS) — This is the method, processes, resources, and models that a company uses to implement Earned Value Management. The key is that Earned Value Analysis formulas can be used on any project, but if an Earned Value Management methodology is not in place, it would be highly unlikely to produce accurate results. Moreover, in order to implement Earned Value Management, there must be an Earned Value Management System in place. The three concepts are therefore very closely linked to each other.
Earned Value Analysis : basic formulas and definitions

To carry out Earned Value Analysis, three key values need to be available: the planned value (PV), actual cost (AC), and earned value (EV). The first and second terms are the planned and actual expenditure cost, and should therefore be easy to obtain. The third term (earned value) is however more complicated to estimate as it measures the amount of value the actual activities completed have created. In detail:
• The Planned Value (PV) is the budget for the work to be achieved within a given period of time. The PMBOK Guide[3].
• Actual Cost (AC), is the cost incurred for the execution of project work, also known as an actual expenditure. It can also be seen as the actual costs (AC) incurred to convert the planned value into the earned value [4]. It is also known as the Actual Cost of Work performed (ACWP). This value can be either calculated through a Cumulative approach or a Current approach. Cumulative AC is the total amount that was spent before a given time, while Current AC is referred to as an interval of time (days, weeks, months…). This is an important consideration as it is key to set regular data collection intervals (once a week, once a month, etc..).
• Earned Value (EV) is the ratio of the total authorized budget actually completed at a certain date. This is also regarded as the budgeted cost of work performed (BCWP). EV can be defined by multiplying the budget for a work package or activity by the percentage of advancement: EV = percent complete x budget. [2]

Once the key parameters are established, and a measuring tool for each of these is defined, some more calculations can be carried out.
- Schedule Variance : SV = EV – PV.
- Schedule performance index : SPI = EV/PV. An SPI value of 1.12 means that 1.12 DKK worth of work was actually completed for each DKK of work that was planned to be done at this point in time. A SPI> 1 and SV> 0 suggest that more work was been completed at a certain date than what was scheduled. However, an SPI > 1.0 does not actually mean that the project is ahead of time
- Cost Variance : CV = EV – AC
- Cost performance Index : CPI = EV / AC. A CPI value of 0.97 signifies that 0.97 DKK is earned of each DKK spent. If the CPI<1 and CV<0 , the cost performance of the project is below what was planned.
Predicting with earned value management
SPI: Schedule Efficiency Indicator

A useful graph is shown in Figure 4, which is a graph showing SPI’s variation in function of time. SPI greater than 1.0 means that more work is done by the team than expected, and an SPI less than 1.0 implies that less work is done by the team than scheduled. A careful approach is important when using SPI, as, without taking into account how the team is doing against the critical path, the project health cannot be evaluated[5]. In this example, SPI is less than 1.0 for the first few reporting periods, as the project is just starting up and activities are being initiated. However, if, after the first few reporting periods, the SPI does not progress towards 1.0, it is a sign of potential schedule issues and, thus, possibly time to begin taking appropriate measures.
Calculating project expenditures using CPI

The Cost Performance Index is an ideal cost-efficiency metric for accomplished work. The primary use of CPI is to forecast the final cost of the project. As highlighted by Lukas JA. [6] a few definitions need to be specified prior to listing the typical formulas used: Estimate to Complete (ETC) - the estimated additional cost required for the project to be completed. Estimate at Completion (EAC) - An approximate total cost of the project at its completion. Budget at completion (BAC) - The complete authorized budget at completion of the project (including any project contingencies). Most of the approaches for estimating the project completion estimate include an analysis of the original cost estimate on the basis of the outcome of the project to date. The formulas that are most common are: EAC1 = AC + (BAC - EV). This calculation is often referred to as the “overrun to date” or “mathematical” formula. This formula implies that the schedule will be executed as planned for the remaining work (CPI = 1.0). If a project is not performing well, this formula tends to be too optimistic. EAC2 = BAC/CPI. In some textbooks, this formula is called the 'cumulative CPI' and it means that the whole project can be carried out at the current value of cost efficiency (current CPI does not vary) EAC3 = AC + ((BAC - EV) / (CPI x SPI)) or BAC/(CPI x SPI). These formulas take into account the effect on the EAC on both cost and schedule and typically produces the most negative EAC for a project not performing well.
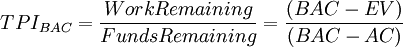
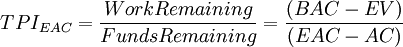
To Complete Performance Index (TCPI)
The To Complete Performance Index (TCPI) allows the project manager to estimate the necessary performance level of the remaining work, expressed in CPI, in order to complete the project on budget. This measure can either be referred to the authorized budget (BAC) or to the current EAC. TCPI provides a "sanity check" for the project manager on whether the required CPI for the remainder of the project is realistically obtainable. Of the two calculations, looking at the CPI required to complete the project based on EAC is probably more meaningful [7]. The two formulas for TCPI are:
The significance of the CPI parameter is empirically proven to stabilize at the 20 percent completion stage of a project (with over 700 DOD projects studied)[8] Also, as the project progresses towards the 100 percent completion stage, the CPI metric becomes increasingly more stable. Stability is defined to mean that the final CPI does not vary by more than 0.10 from the value at 30% complete [9]
From Lipke W, Zwikael O, Henderson K, Anbari F. [10] it is shown that the 20 percent complete CPI stability is likely to be applicable only to extremely large long-term projects. It is therefore unclear whether small-project managers should expect accurate data from their use.
Application
Limitations
Annotated bibliography
References
- ↑ Fleming QW, Koppelman JM. Using earned value management. Cost Eng (Morgantown, West Virginia). 2002;44(9):32-36.
- ↑ 2.0 2.1 2.2 2.3 2.4 2.5 2.6 2.7 Lukas JA. How to make earned value work on your project. PMI® Glob Congr 2012—North Am Vancouver, Br Columbia, Canada. 2012;(5):1-9
- ↑ PMBOK Guide
- ↑ Fleming QW, Koppelman JM. Using earned value management. Cost Eng (Morgantown, West Virginia). 2002;44(9):32-36.
- ↑ Fleming QW, Koppelman JM. Using earned value management. Cost Eng (Morgantown, West Virginia). 2002;44(9):32-36.
- ↑ Lukas JA. How to make earned value work on your project. PMI® Glob Congr 2012—North Am Vancouver, Br Columbia, Canada. 2012;(5):1-9.
- ↑ Lukas JA. How to make earned value work on your project. PMI® Glob Congr 2012—North Am Vancouver, Br Columbia, Canada. 2012;(5):1-9.
- ↑ Fleming W. The Earned Value Body of Knowledge (EV-BOK). Published online 2002:19073
- ↑ Lukas JA. How to make earned value work on your project. PMI® Glob Congr 2012—North Am Vancouver, Br Columbia, Canada. 2012;(5):1-9.
- ↑ Lipke W, Zwikael O, Henderson K, Anbari F. Prediction of project outcome. The application of statistical methods to earned value management and earned schedule performance indexes. Int J Proj Manag. 2009;27(4):400-407. doi:10.1016/j.ijproman.2008.02.009