Fishbone diagram

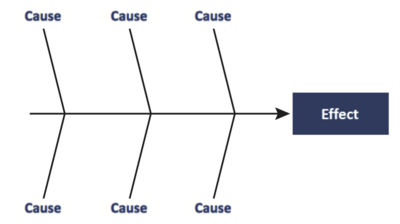
The Fishbone diagram is named for its resemblance to a fishbone. The investigated problem is placed of the "head" and the identified root causes comes out of the "spine" like ribs, see the illustration. It is also called an Ishikawa diagram after its creator Kaoru Ishikawa, or a Cause-and-Effect diagram. Ishikawa created it as a tool in a toolkit for quality control. Its use has since turned towards identification of root causes for problems. This has made it a valuable tool for risk identification, and in a wider sense in Risk Management as it can help a team figure out how best to handle the risks with ARTA[1]. The Fishbone diagram has the benefits of being a systematic and organised way of finding potential causes to a problem and of encouraging the team using it to talk about both the problem and its causes. Part of this talk will have the outcome of having ranked the root causes according to their likelihood of happening and how easy they are to fix or control. This allows the team to prioritise and better manage their risks.
This article will consider how the diagram is appropriately used in Risk Management as well as its purpose and limitations. It will also touch upon tools that can be used in conjunction with the diagram to strengthen a project's management of risks. The article will be based on previous literature on the subject.
Contents |
The Purpose of the Fishbone Diagram
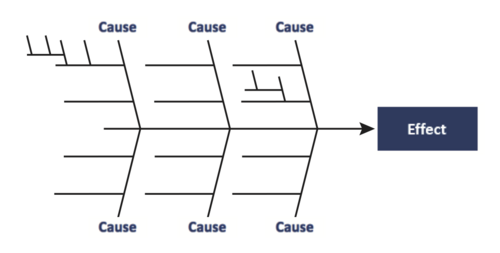
The purpose of the Fishbone diagram in Risk Management is to identify various root causes of a potential problem for a project or program[2]. It does so by having the user brainstorm over various causes for the problem and continuously going to deeper levels by finding the cause of the previous cause. Thus a cause-rib might have more subcauses, see the illustration. The process of making new "ribs" on the fish continues until the team agrees that the root cause has been reached. In this way the tool aims at organising the causes for the investigated problem. But the team does not have to find deeper levels for each cause they identify, only for those that they deem are "Very Likely" or "Somewhat Likely" to happen and will be "Very Easy" or "Somewhat Easy" to control or fix (see "Application" for reading more about these gradings). The reason for this is so that the team does not waste time and effort on treating a cause that is unlikely to happen or that they won't be able to do anything about anyway. If the team is hard pressed for time and have a lot of causes to look into, they can start with the ones they deem will have the highest impact or effect in causing the problem.
Application of the Fishbone Diagram
When a team is doing Risk Management they will often need several Fishbone diagrams as each one only corresponds to one problem while several problems may arise during a project. A problem could be something like the risk of customers not buying a car. Thus the problems are the risks the team will want to manage. It is also called an effect which is how the diagram also got the name Cause-and-Effect diagram. When using the Fishbone diagram it is particularly useful to do so on a large surface -such as e.g. a whiteboard, with lots of space for causes, sub-causes, and root causes, since the team cannot know at the beginning of the process just how many of these will be needed. Following is a step by step guide on using the fishbone diagram[3]:
- The investigated problem should be written in the far right side of the whiteboard and a horisontal line to the left of it. Some make it an arrow aiming at the problem [3][4] to illustrate that this is the effect of the causes that are to be identified. But whether it is an arrow or just a line is of no consequence to the functionality of the diagram and is so up to the personal preferences of the team.

- Now the causes for the problem, should be written a good distance of to each side of the line -there should also be some distance between the causes themselves. Lines are drawn from each cause to the line. Again these lines can be made into arrows[4] or not[5], if the team prefers.
- The appropriate sub-causes can now be fitted into each of the causes by making horisontal lines on either side of the line connecting a first level cause with the "spine" of the fish. The sub-cause should be written either at the end or along this new line. Whether sub-causes are needed or not is largely up to the team and how detailed they want to do the diagram. It is entirely possible to solve the problem without deeper level causes -in this case what would otherwise be a sub-cause is now a root cause. An example could be that for a cause named "People" a sub-cause could be "Employees not showing up for work". In this case the team could decide that this a root cause and a brainstorm on how to solve the problem could give the solution to change the way employees are paid into depending on how much time they spend at work or to put a limit on how many sick days employees are allowed. Another action would be that the team decides that "Employees not showing up for work" is a sub-cause from which the root cause "Employees bully each other" is found. Now the team can brainstorm other ways to manage the problem, and will probably reach other conclusions than in the previous scenario. If the first scenario happens it is likely that the work environment will worsen further and that one or more employees will leave the company. This of course creates new problems for the company as it is symptom treatment rather than doing something about the root of the problem, the root cause, which as it turns out the team had not managed to find after all. To find the root cause the team must continually ask why this happens. Why do the employees not show up for work? Why are the employees bullying each other? etc. This approach is called "The 5 Whys" as this is the approximate amount of whys a team will need to ask in order to reach the root cause[4][6].


It should be noted that though this is presented as a step by step guide it might be that the team e.g. fills out a cause before making the next, or once having filled out all the causes realises that some of the sub-causes from several of the causes are connected and better treated in a new cause made just for them. It is possible to go back in the steps to alter the output of it. It means that team didn't know all they thought they did at the beginning and is figuring out something new about the project. If the team used any tools or methods to find the causes, the team might need to go through those again to make sure they have all relevant causes.
After having used the Fishbone diagram to identify the root causes for a problem the team can grade them in regards to how easy to fix or control they are and how likely they are to happen. This will help the team prioritising which causes to treat and how to manage their time and effort. This is important in order for the team to get to use the knowledge they had just gathered from the Fishbone diagram. A way of grading this could be "Very Easy", "Somewhat Easy", "Not Easy" and "Very Likely", "Somewhat Likely", "Not Likely". The causes the team should focus on have the combinations "Very Easy-Very Likely", "Very Easy-Somewhat Likely", and "Somewhat Easy-Very Likely"[7][3].
The Team
The Fishbone diagram facilitates communication in the team as it requires the team members to discuss the likelihood and effect each of the identified causes might have on the project. As in how likely each cause is to cause the problem. This allows the team to treat the problem as according to ARTA[1] by handling the root causes of the problem. When using the diagram a diverse team can be an advantage as the team is likely to identify more causes, but it is also very important to have a common ground on which to grade the likelihood and effect of each root cause, which can be difficult for a too diverse team as each member will tend to focus on the causes they are the expert in. As such they may not be able to relate the likelihood and effect of the root causes of their own causes to those of the other causes. This can potentially lead to some root causes being underestimated while others are overestimated, so that some root causes will not get the attention and contingency plans they deserve and need because it is given to other root causes. Thus the problem might happen anyway without an effective contingency plan. This goes to show, that proper communication and a common ground or standard on which to grade the effect and likelihood of a cause is very important when using the Fishbone diagram.
A less diverse team might have an easier time finding this common ground or standard, but in return it is less likely that they find all the relevant root causes or have the knowledge to make the appropriate contingency plans.
Here a diverse team means that that the members have different strengths in the form of a cause for the diagram. As an example think of a team from a start-up company making a new car. The team might be discussing something like why the car is not selling well. There might be someone in the team who is the expert on the car as a product, and someone who is the expert on the market wants and needs, etc. But without an expert on the sales channels the team might overlook that all of the car distributors have agreements or contracts with other and bigger car fabricants, that means they are either not interested in or allowed to do business with the start-up company. Here being the expert simply means that the person is in charge of that specific aspect of making or selling the car and in the light of this naturally will have more knowledge about this category than the other team members.
When a team uses a Fishbone diagram it is important that they have an in-depth understanding of the problem[3] in order to reach all the right root causes. Thus the team should consist of those who are closest to the problem. If this is impossible those closest to the problem at the very least be involved in the brainstorming to find the relevant causes and root causes.
Common ways it is used
In Project Management the Fishbone diagram is usually used in Manufacturing, Services, or Product Marketing. It can also be used in other contexts than what would traditionally be considered Project Management, such as e.g. for medical purposes[5], where i.e. the cause(s) for a patients symptoms are found. Because of the frequent use in the first three mentioned contexts several standards for first level causes exist for them. Of course if a team should need to, they can add or subtract any course they want. These standards exist as guidelines to help teams think of and consider various causes for the problem they are treating and can be a good starting point.
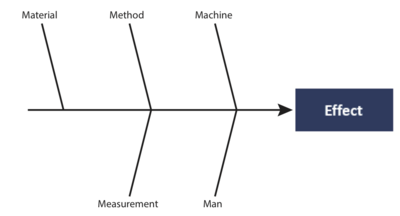
For Manufacturing two such standards exist:
- The first originates from lean manufacturing and the Toyota Production System, it is The 5 Ms[7]
- Machine (which covers the equipment and technology)
- Method
- Material (which covers both raw material, consumables, and knowledge)
- Man (which covers both physical and knowledge work)
- Measurement (which covers inspection and environment)
- Sometimes it is relevant to include three extra Ms, these are:
- Mission (which covers the purpose and the environment)
- Management
- Maintenance
- The second one considers these causes[4]
- People
- Material
- Equipment/Machinery
- Methods
- Environment
- Measurement


For Services another two standards exist:
- The first considers these causes[4]:
- People
- Policies
- Procedures
- Location (this usually includes equipment and machinery)
- Measurement
- The second one is called The 4 Ss[7] and considers these causes
- Surroundings
- Suppliers
- Systems
- Skills


For Product Marketing this standard exists
- The 8 Ps[7]
- Product (would be service for Service Marketing)
- People
- Price
- Promotion
- Process
- Physical evidence
- Performance
- Place

Limitations of the Fishbone Diagram
As with any other tool the Fishbone Diagram has limitations and one of them is the people it is used by. People sometimes won't think of everything that might be relevant to put on the diagram, that is why the above mentioned guidelines exist. However it might also be that the team members just do not know enough about certain aspects of the project to identify all the relevant causes for the problem. It is also possible that the team misjudges the likelihood for one or more of the causes or ease with which they might be controlled or fixed. This could happen e.g. because the team members do not know enough about the subjects that they are not the expert of themselves and the team does not have a common ground or standard by which to decide in what category of likelihood and ease of controlling or fixing a specific root cause fits. The outcome of all of this could be that the team focusses on the wrong root causes and that the team might not even be aware of the root causes they should have been focusing on.
What the tool will not achieve
The tool is meant to identify and organise the root causes to a specific problem [2][7]. Thus the tool itself will not help the team in finding solutions for the problem, it merely provides a more concrete context or specification for the solution. The diagram also does not translate the identified solutions into actions, that is up to the team, and it cannot help the team find the best way to execute the necessary actions or even to identify the actions necessary to execute the solution. The diagram itself does not constitute Risk Management or even a full Risk Analysis[2], more tools and methods are needed to do either of those properly and some suggestions for them are mentioned in the following section. To put it shortly, the Fishbone diagram will help organise a team's knowledge about a problem, but it will not help the team quantify the problem or decide what the appropriate response should be. If the team only does the Fishbone diagram they might be aware of certain problems or risks they might encounter, but they will have no plan for how to manage them or otherwise do any form of damage control.
Tools the Fishbone diagram is often used in conjunction with to achieve the end goal
The Fishbone diagram was created by Ishikawa as a tool in The Seven Basic Tools of Quality[8]. Other tools from this basic toolset includes the Pareto Chart, which has given way to the Pareto Analysis or Method[2][9]. A basic 80/20 rule of this analysis says that about 80% of the team's problems will be from the same 20% of their causes. To uses this in conjunction with the Fishbone diagram means that the team will find out which 20% of their causes will cause 80% of their problems and focus their efforts in Risk Management on them.
Another good tool to use in conjunction with the Fishbone diagram was presented in step 3 of the Application. It is of course The 5 Whys. This method will heighten the quality of the output of the Fishbone diagram as it helps the team dig deeper until they reach the root cause of the problem. Another tool that -like The 5 Whys, will always be used to some extent in conjunction with the Fishbone diagram is Brainstorm. This is in order to identify the problem that is to be treated with the diagram as well as for identifying the relevant causes, sub-causes, and root causes. To get started on identifying the problem the Fishbone diagram can be used in conjunction with a Potential Problem Analysis[10]. The Potential Problem Analysis identifies potential problems for a product or service by breaking it up into the required steps for providing it. Then it identifies potential problems for the steps and rates them according to the likelihood of it happening and the impact it might have. This will help identify what problems it might be relevant to treat with the Fishbone diagram. Once an overview of these risks has been created the team can take preventive measures and make contingency plans. These might be kept in a register to make it easier and quicker for the team to act once they encounter one the problems.
It should be noted that these tools are only suggestions on how to take better advantage of the Fishbone diagram to reach the goal of doing proper Risk Management -which would be the reason why a team would use the diagram in the first place. It should also be noted that this list is in no way exhaustive.
References
- ↑ 1.0 1.1 Geraldi, Joana; Thuesen, Christian; Oehmen, Josef; How to DO Projects Version 0.5 BETA VERSION, (July 27, 2016)
- ↑ 2.0 2.1 2.2 2.3 Ilie, Gheorghe; CioCoiu, Carmen Nadia; Application of Fishbone Diagram To Determine The Risk Of An Event With Multiple Causes, Knowledge Management Research & Practice, January 2010
- ↑ 3.0 3.1 3.2 3.3 Walsh, Ronan; Fishbone Diagram - How to Make and Use a Fishbone Diagram, http://lbspartners.ie/fishbone-diagram/ , (August 3, 2017)
- ↑ 4.0 4.1 4.2 4.3 4.4 Cause and Effect Analysis using the Ishikawa Fishbone & 5 Whys, http://www.cityprocessmanagement.com/Downloads/CPM_5Ys.pdf
- ↑ 5.0 5.1 Wong, Kam Cheong; Woo, Kai Zhi; Woo, Kai Hui; Quality Improvement in Behavioural Health, chapter 9: Ishikawa Diagram, Springer International Publishing Switzerland, (2016)
- ↑ Fishbone (Ishikawa) Diagram, Learn About Quality, http://asq.org/learn-about-quality/cause-analysis-tools/overview/fishbone.html
- ↑ 7.0 7.1 7.2 7.3 7.4 Ishikawa diagram, https://en.wikipedia.org/wiki/Ishikawa_diagram
- ↑ 7 Basic Quality Tools For Process Improvement, http://asq.org/learn-about-quality/seven-basic-quality-tools/overview/overview.html
- ↑ Taylor, Harvey, Project Management, Pearson (2010)
- ↑ Potential Problem Analysis, https://healthit.ahrq.gov/health-it-tools-and-resources/evaluation-resources/workflow-assessment-health-it-toolkit/all-workflow-tools/potential-problem-analysis
Key references
4. This article gives an introduction to the Fishbone diagram and how to use it in conjunction with The 5 Whys.
7. Wikipedia gives a brief overview of the tool and explain common first level causes for production, marketing, and service. Lastly it describes how the tool can be used in lean.
2. This article explains more of the history of the Fishbone diagram and diagram itself. The article demonstrates how to use the tool with codification and draws relevant conclusions for the Fishbone diagram itself as well as for being used in this conjunction.
3. This article explains why teams should use the tool then give a step by step explanation on how to use it.