Gantt Chart in Project Management
Developed by Mehmet Cagri Hekim
Contents |
Abstract
Nowadays using one of THE most known project management tool, Gantt chart, can almost be considered as a world standard even though the method is quite old. [1] It can be easily mentioned that Gantt chart is one of the essential tool for project managers in order to construct and schedule different tasks and see these tasks against time.[2] The tool simply offers to visualize different tasks, their dependencies, time limitations and other project management related specifications in order to allow project managers to follow and act for completing the intended work at intended time duration. In short, the tool offers project managers to define problems,control them and accept different solutions when there is a need. [2] Especially, with the increase of more powerful microchip usage in today's computers,the computational power also increased. As a result of this technological development, usage of Gantt chart also increased radically since the new tools allow users to create and follow the Gantt chart for more complex and detailed projects. In addition, these tools also allow project managers to interfere and fix complex situations and problems easily. Using Gantt chart during the project management was accepted as one of the main criteria to be a serious and successful project manager back in days, which indicates how well known it is as well as how big it's social impact can be on the other people. Therefore, Presenting projects to the stakeholders,higher authorities or other related people by using Gantt Chart may have serious social impacts such as; being considered as a more respected,rigorous, professional project manager in the industry. [3] Regarding the essential aim of the article, it can be mentioned that it will simply explains the concept of Gantt Chart and its usage by providing the details about its history, application, advantageous and observed limitations.
The Author and History

As like most of the innovation has been found during or with the cause of the war, the Gantt Chart has also been found during the World War 1 by industrial process consultant H.L. Gantt in order to help the American army due to the fact that there was an over production demand and thus this process needs to be managed as a project.[4] The first intention of H.L. Gantt to create a visual to show a comparison between promises and performance. After the General Croizer’s ( former mathematic instructor, general, planner of American Army) appreciation regarding the creation of the first Gantt Chart, this simple tool spreader through the different fields of the military. [4]
Traditional Approaches
The domain, Project management, is considered as a well-developed and accepted field for the exercise of professional expertise as well as an area for academic research.[5]
Traditional Project Management
In terms of the project management approaches, according to Wysocki’s paper, if the goals and solutions are known from the beginning of the project, the simplest project management approach to facilitate a project is, the method called Traditional Project Management (TPM), which were introduced in 1950s and it is known that since then this method has been used widely around the world.[6] According to this approach, the process order is named as project life cycle and can be listed as; initiation, planning & design, execution, monitoring and controlling systems and completion. [7] TPM aims to complete the project with defined limitations with the given knowledge for each steps during the initiation step. Since the aim is to complete the project just in time as planned, it does not allow for external participation thus client participation is not allowed. Even though, it may be mentioned that the change process of people's mindset and habits, is one of the toughest work in the world, nowadays, people start using the relatively younger project managmeent method, agile, really often.[7]
Agile Project Management
Regarding the Agile Project Management (APM), even though the root of the method relies on 1930s, the official recognition by the industry happened in August 2001 with the movement of a group of software development experts.[7]Some of them can be given as; “uncovering better ways of developing software by doing it and helping others to do it”, “costumer collaboration over contract negotiations” and “Responding to change over following a plan”.[7] Shortly, depending on different circumstances, the agile method is also preferred by project managers and the ratio of usage is currently increasing swiftly. It is important to mentioned that, for both type of traditional project management approach, the tool Gantt Chart is commonly used by project managers in order to visualize the tasks, to manage the changes, to check the constrains as well as to achieve the project goals.
Gantt Chart Usage in Project Management practices
According to the Diana White’s and Joyce Fortune’s research about most used project management practices, project management software and Gantt Chart have been found as the most widely used management aids during the projects.[5] It was observed with the conducted research regarding the frequency of usage of project management methods, methodologies, tools and techniques, Gantt Chart bar usage was found as a the second most used tools with the ratio of %64, where the most used tools are project management software. (Reference). In that point, it is important to mention that, the project managing tools are mostly used Gantt Charts to schedule and visualize the works and/or tasks against the time, which simply indicates that the importance of the Gantt Chart usage within the project management. Just after that point, it is also important to underline that the research of White’s and Fortune’s also examined the other project management tools and methodologies have high limitations, whereas, in this research, the tool Gantt Chart is not placed in any of the limitation list, which is a significant fact that shows the usability as well as simplicity of the Gantt Chart. [5] Therefore, it can also be said that the traditional practice of using Gantt chart mainly relying on its simplicity and usability for almost everyone. One of the most important point about the reliability and the common usage of the tool can be mentioned as that the tool is used by project managers easily during both Agile and waterfall project management types. Since, even though the structuring and prioritizing of these project management tools are different, the tasks that needs to be scheduled and planned, stays same. This can be considered as the significant point of the high usage of Gantt Chart method due to the fact for both professional and unprofessional life. Therefore, it can be said that every task that intended to be completed by considering different constraints are appropriate to be visualised with Gantt Chart. For the conclusion of the traditional approach, the project management tool, Gantt Chart, has been used for a long time within different project management methods in order to track the progress of scheduled activities and tasks.
The Concept of Gantt Chart
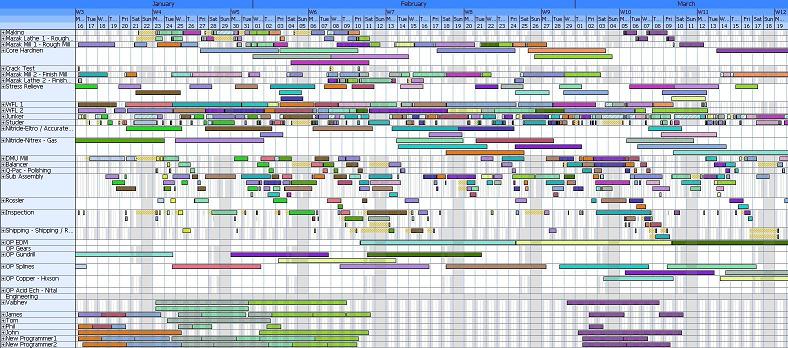
The Gantt chart is a bar that horizontally placed production/progress control tool which gives an illustration for condition of a scheduled work or project. [8] The tool consists of vertical and horizontal axis. The horizontal axis indicates the time span of the project such as: days, weeks and months. The other vertical axis represents the task that needs to be worked on, in order to complete the intended project in intended time. These tasks can be example as; completing the Arduino code, assembling the servo motors, connecting/attaching the wires etc. The examples can be varied by different industries and any task that needs to be completed as a step towards the finish can be put in a Gantt Chart. The simple Gantt chart visual can be seen from the figure 1.

Constrains
In that point, the significant factor between these task, dependencies, need to be clarified. The possible dependencies between the tasks are separated into 4 different categories such as; Finish to Start (FS), Start to Start (SS), Finnish to Finish (FF) , Start to Finnish (SF). In order to list the different tasks in terms of their dependencies, the terms predecessor and successors are mainly used in the industry. The predecessors of a task X mean that the necessary tasks that needs to be completed in order for the task X to start. Whereas the successor of task X means that, the successor tasks can only be started when the Task X is completed. The better visualization and example of successor and predecessors can be examined from the figure 2.
The first one finish to start may be considered as the default type. Since, it may be thought that most of the activities in a project have their own order and in order for second activity to start, the first activity needs to be completed. [1] The second one, start to start can be described as the situation in which the task X can only start when its predecessors start. Since, the projects became more complicated in 21st Century, it is not rare to see SS dependencies between the task. These can be easily explained with the fact that “the more task can start, the faster the work done” as well as “the more complex the project, the more tasks need to completed together to finish the project on time”. The third one Finish to Finish dependency is a situation where the task X can only be terminated/completed when its predecessors are completed. In this kind of dependency there is a fact that needs to be underlined, which is the task X cannot be completed before its predecessor ,but it can, after when its predecessor tasks are completed. The last dependency Start to Finish can be explained as the situation where the Task X cannot end before it's predecessor tasks start, but it can end after when it's predecessor tasks are completed. This kind of dependency can be stated as very rare. [1]
The other action/terms that are used widely, lead and lag time, should be mentioned as well. Since, the project management world can be names is a world that there are many unknowns, which can cause possible changes, it is normal to expect some changes on the time span of the different but dependent tasks.In case of a Finish to Start task dependency between task X that run from day 1 to 10 and Task Y that run from day 10 to 20, the starting date of Task Y can be moved back with using the lead time. In short, using the lead time allows project managers to bring the starting time of the second task back within the time span in which the task Y can be started even though the Task X will not be completed yet. This act may possibly fix the possible delays of a project objective.[1]
The other act, lag time, can be explained also by considering the same mentioned tasks, X and Y. In order to shift the starting date of task Y for a bit further, using lag time add some more days between these 2 dependent tasks. Shortly, the Task Y can be started a few days later than it should even though task X is completed.[1]
Additionally, even though they are not considered as constrains due to the fact that their high flexibility, some constrains can be added in to the Gantt Chart such as; As soon as possible situation (ASAP) and As Late As Possible situation (ALAP). [1] Even though, the application of these constrains can be made by hand, since most of the industry use project management software, it would be easier to describe it through the application of a project management software. When The first term ASAP is applied for an independent task within the scheduled project, this fact allows the project management software to schedule this task to the starting point of the project. Whereas, in case of applying this constrain to a dependent task, the software will automatically calculate the earliest possible starting point of this task and schedule it in a point where it will start as soon as possible. Regarding the application of second term, ALAP, this action allows the project management software to schedule this task in a position where the task’s end date will fit the end date of the whole project. Whereas, in case of applying this constrain to a dependent task within a project, the project management software will naturally calculate the latest possible start point of this task and schedule it in a point where it can start as late as possible.
The stricter constrains can be ordered as; Start No Earlier Than (SNET), Start No Later Than(SNLT), Finish No Earlier Than (FNLT), Finish No Later Than(FNLT), Must Start On(MSO) and Must Finish On(MFO). While explaining these constrains the explanations will be provided with using the word “May”. Since, even though one of these constrains are adjusted into the project management software in order to schedule a new project Gantt Chart, there is still a chance that these constrains cannot be applied by the software and therefore the start and finish dates of the task can be changed and thus the tasks may placed differently according to the calculation of the project management software.Regarding the explanations of these constrains[1];
- The constrain, SNET, mean that the specified task, no matter if it is dependent or independent to another task, may not start before a given date.
- The constrain, SNLT, mean that the specified task, no matter if it is dependent or independent to another task, may not start later than a given date.
- The constrain, FNET, mean that the specified task, no matter if it is dependent or independent to another task, may not end before a given date.
- The constrain, FNLT meant that the specified task, whether it is dependent or independent to another task, may not end later than a given date.
- The constrain MFO, mean that the specified task, no matter if it is dependent or independent or another task, must completed on a given date no matter other conditions is. Therefore, this constrain can be considered as a rigid one.
- The constrain MSO, mean that the specified task, no matter if it is dependent or independent or another task, must start on a given date no matter other conditions is. Therefore, this constrain can also be considered as rigid.
Advantages
The one of the most used project management tool, Gantt Chart, can offer some advantageous to project managers. First of all, it is important to mention that visuals, graphics, charts and other illustrations have significiant positive impact on human psychology. That can be said that, creating the mentioned visuals has big supplementary fact for helping people to understand complex and detailed projects and tasks. [9]
The other advantage of using Gantt Chart is that the tool allows project managers to divide the big picture into the smaller parts and demonstrate them in a more detailed way such as resource allocation, time span, dependencies etc. This dividing process and demonstration can help users to understand if they are able to finish the project on time or not as well as giving a detailed information of how well is the project managed so far in terms of different expectations and goals. [10] The other advantage can be stated that using the detailed Gantt Chart may allow project managers to be seem more serious and disciplined regarding on the work that they are responsible from. In addition, using the tool can also be considered as a more professional and structured way of presenting your ideas to the other people who can be a stakeholder, investor, etc.
Disadvantageous/Limitations of Gantt Chart
.jpg)
[12]The other limitation of Gantt chart is that if the project is a mega one, then it may get too complicated to understand and see the overall picture. Therefore, even though the tool is used for massive projects as well, it is easier to apply and manage small project with using Gantt Chart. [13] In that point, it should also be underlined that even though it is recommended and mainly preferred to use Gantt Chart with project management software (Microsoft Project, Project Libre etc..), it is still a bit hard to follow and control mega sized Gantt Charts due to fact that the complex,over detailed and massive visuals. Therefore, it can be mentioned that using Gnatt chart may be confusing for the project managers in massive and complex projects.
Conclusion
As a conclusion, Gantt Chart concept can be considered as a well-known and successful approach of project management practices. It is accepted as effective and useful way for scheduling, following and controlling the projects in which different tasks are aimed to be completed in a restricted time durations. It is essential to state that, as it can be examined from the previous descriptions, the tool can be used more easily with the help of a project management software. Since, it would be easier to calculate the requirements of the constrains and reschedule the tasks according to the new intentions by using the project management software.
References
- ↑ 1.0 1.1 1.2 1.3 1.4 1.5 1.6 1.7 Gantt.com (2016), What is a Gantt chart?,web:http://www.gantt.com 'In this reference the overall Gantt Chart concept and short history of the tool can be found.Therefore, the reference can be examined as very useful to obtain basic understanding about the tool'
- ↑ 2.0 2.1 James M. Wilson (2003), Gantt charts: A centenary appreciation, European Journal of Operational Research, Volume 149, Issue 2, Pages 430-437, ISSN 0377-2217" , web:http://dx.doi.org/10.1016/S0377-2217(02)00769-5 (http://www.sciencedirect.com/science/article/pii/S0377221702007695) , Keywords: Project management; Machine loading; Production planning; Gantt charts 'In this reference the importance and historical development of Gantt Chart usage is explained. It is really nice paper to read in order to investigate the relation between the production and scheduling processes with Gantt Chart Usage.'
- ↑ ,Maylor H. 2010, Project Management',London: Financial Times Prentice Hall, ed. 4th edition 'This references is from one of the most known and used hand book of project managers nowadays. The book covers different significant project management facts as well as application of the project management tools to the real cases. Shortly, book can answer very wide range of questions about project management and its practices.'
- ↑ 4.0 4.1 ,Nathan Black (2014), A Brief History of Time(lines): Henry Gantt and his Revolutionary Chart", web:https://www.onepager.com/community/blog/a-brief-history-of-the-gantt-chart/ 'In the article of Nathan Black, the brief history of Gantt Chart and its founder Henry Gantt is given. Therefore, this reference can be used to understand and examine the development steps of Gantt Chart and its history.'
- ↑ 5.0 5.1 5.2 White,D.,Fortune,J.(2012). Current practice in project management—An empirical study. International journal of project management,web:http://www.sciencedirect.com/science/article/pii/S0263786300000296 'In this reference the project management practices are discussed. The paper examines the findings of conducted survey for people who are in project management world.
- ↑ Wysocki,R.K.(2011). Effective project management: traditional, agile, extreme.John Wiley & Sons. ,web:http://samples.sainsburysebooks.co.uk/9781118742105_sample_394681.pdf 'In this book the different approaches of project management are discussed. In terms of finding relevant information about the Traditional Project Management (TPM), the book is really useful.
- ↑ 7.0 7.1 7.2 7.3 UKEssays (2013). Project Management Approach Information Technology Essay. In this article, the key points about traditional project management and agile project management practices and their main differences can be observed
- ↑ ,TechTarget (2007), Gantt chart,The Definition. web: http://searchsoftwarequality.techtarget.com/definition/Gantt-chart 'The page covers overall description of Gannt Chart,its structure and its design.'
- ↑ John Jeffrey, PM Hut (2009), 'Advantages and Disadvantages of Gantt Charts',web:http://www.pmhut.com/advantages-and-disadvantages-of-gantt-charts 'In this reference the advantageous and disadvantageous of the tool,Gantt Chart, are discussed and exampled. The page is really useful to make observation on the negative and positive impacts of using Gantt Charts.'
- ↑ Debbie Jones, Teach-ICT.com, 'Advantages and Disadvantages of Gantt Charts',web:http://www.teach-ict.com/as_a2_ict_new/ocr/A2_G063/331_systems_cycle/planning_tools/miniweb/pg4.htm ' this reference is also about the advantageous and disadvantageous of the tool,Gantt Chart.'
- ↑ Google.com (2016), Google Pictures,web:http://1.bp.blogspot.com/-_7g6MG6XDYw/T4VTUS5h_LI/AAAAAAAAACM/NfzixKRsXbk/s1600/PanklGanttChart.JPG
- ↑ reference.com, What are some of the advantages and disadvantages of a Gantt chart?, web:https://www.reference.com/math/advantages-disadvantages-gantt-chart-59d26ab2d962e1b# 'The reference gives short information about some of the observed limitations of Gantt chart usage.'
- ↑ Ronda Bowen,Michele McDonough,(2013), When Gantt Charts Aren't the Answer?,web:http://www.brighthubpm.com/project-planning/52723-disadvantages-of-gantt-charts/ 'This reference also explains some of functional Gantt Chart limitations.'