Gantt chart and Scheduling techniques
| Line 37: | Line 37: | ||
'''Step 2- Creating the bars:''' Create bars representing each activity. The length of the bars should be proportional to the duration time. If there are multiple activities it is a good idea to | '''Step 2- Creating the bars:''' Create bars representing each activity. The length of the bars should be proportional to the duration time. If there are multiple activities it is a good idea to | ||
<br> | <br> | ||
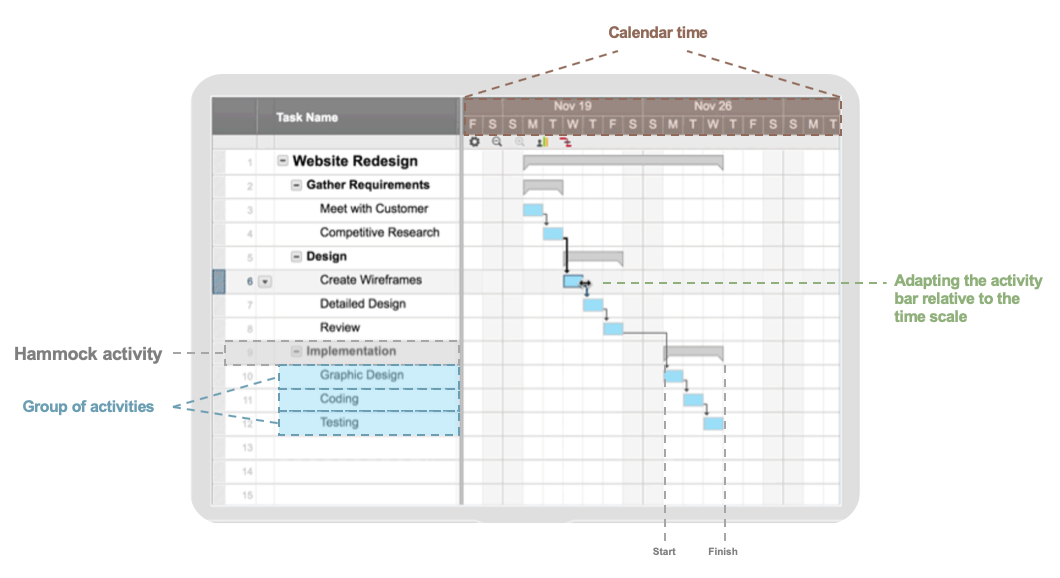
| − | [[File:Gantt_new.png| | + | [[File:Gantt_new.png|frame||650px|Figure 1: How to create a Gantt chart. Reproduced from: [https://www.smartsheet.com/s/global-online-gantt-chart?s=39&c=73&m=414&a=273148107325&k=%2Bgantt%20%2Bchart&mtp=b&adp=1t2&net=g&dev=c&devm=&mkwid=sDQm8pEhv%7Cdc&plc=&gclid=CjwKCAiA767jBRBqEiwAGdAOry5jQ9hMlDp4YGDdGeI_FUbOeIOkKi-bDahkqqVYd7IRkFWmnEE_DBoCpB4QAvD_BwE ]]] |
<br> <br> | <br> <br> | ||
'''Step 3''' | '''Step 3''' | ||
Revision as of 17:10, 20 February 2019
Contents |
Abstract
The abstract should not exceed about 250-300 words. It should consist of the summary of your article, as well as a table of contents with bullet points explaining the content of each section. Please already include key references in the abstract.
The scheduling techniques that are going to be explained in this article are Gantt and CPM - hereby Network Diagram
- have they works
- have to use them in practice
- have they are connected and supplement each other
Goal: to simplify the different scheduling techniques, how to use them and connecting them to each other
Scheduling
A plan can only show the practicability of accomplishing its objectives when the actions and activities in the plan, are put together in a schedule that illustrates when each action or activity will be carried out.
Today there is many different methods and approaches to scheduling. It can either be by computer-based planning tools or done manually [1].
Tools like Gantt chart and Critical Path Method (CPM) are tools often used in the planning process of a project.
Gantt chart
Definition
"A graphic display of schedule-related information. In the typical bar chart, schedule activities or work breakdown structure components are listed down the left side of the chart, dates are shown across the top, and activity durations are shown as date-placed horizontal bars." [2]
When and why use Gantt chart?
Assess how long a plan should take, lay out the order in which tasks need to bed carried out Manage the dependencies between tasks See what should have been achieved at a certain point in the time See how remedial action may bring the plan back on course
How to create a Gantt chart?
There are many ways to create a Gantt chart and in the end, it depends on the project.
| Step by step to construct a Gantt chart | |||||
|---|---|---|---|---|---|
|
Step 1 - Creating the axes: Create a sheet with vertical and horizontal axes. The vertical axis represents the activities, and the horizontal axis represents the timescale. To make the Gantt chart more clear and get and an idea of the total time that needs for each activity, adding the calendar time in timescale is a good idea.
 Figure 1: How to create a Gantt chart. Reproduced from: [2]
| |||||
Critical path method (CPM)
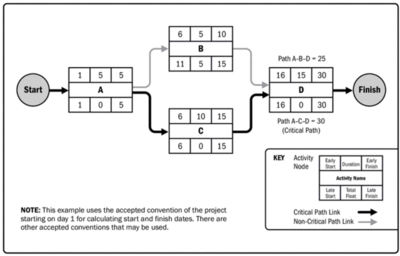
"A schedule network analysis technique used to determine the amount of scheduling flexibility (the amount of float) on various logical network paths in the project schedule network, and to determine the minimum total project duration. Early start and finish dates are calculated by means of a forward pass, using a specified start date. Late start and finish dates are calculated by means of a backward pass, starting from a specified completion date, which sometimes is the project early finish date determined during the forward pass calculation.” [3]
Constructing a Network Diagram
| Checklist when creating a Network Diagram | |||||
|---|---|---|---|---|---|
| 1. 2. | |||||
The connection
References
- ↑ Managing Successful Projects with PRINCE2. (2017). Managing Successful Projects With Prince2. The Stationery Office Ltd.
- ↑ Guide, A., 2001. Project management body of knowledge (pmbok® guide). In Project Management Institute. (p. 436)
- ↑ Guide, A., 2001. Project management body of knowledge (pmbok® guide). In Project Management Institute. (p. 431)

