How PERT builds up on CPM
Developed by Olöf Run Sigurjonsdottir
In project management it is necessary to use a tool which states how the project is going. The project manger faces the challenge of planning, coordinating and monitoring the project, which can be difficult if no tool is at hand [1]. Therefore, project managers often use the Critical Path Method (CPM) and Program Evaluation Review Technique (PERT) to do those things. The tools give a good overview of how a project progresses. Over the years, CPM and PERT have been used in a wide range of projects. For example, in building constructions, maintenance of equipment, design and installation of management systems, organizing transportation projects and so on. [2]
The CPM organizes project’s tasks, which need to be done to complete a project, and estimates how much time it will take. Also, the method shows what tasks are sensitive in a project because these tasks may take more time. [3] This method shows visually how the tasks relate to one and another. [4] Therefore, the key essence of the CPM is to compute the shortest time, which a project can take, by valuating a task according to its predecessors.
As for the PERT, the method also shows visually how the tasks relate to one and another as CPM does. However, PERT takes into account that the duration of a task is not always known. So, the method uses three estimated times to calculate most likely duration of a task and hence the project as a whole. [5]
This article will begin by going through the history of the methods and how the CPM has been improved over the years. Then, some key concepts will be described and defined. Furthermore, the CPM and PERT will be explained and an example taken and calculated to see how the methods work. Advantages and limitations of each method will be listed and described. In the end, will be gone through how PERT builds up on CPM.
Contents |
Overview
History
The history of project management tools like the CPM can be traced back to ancient Egypt. For example, when ancient Egyptians build the Great Pyramid of Giza, which stands near Cairo. That project was more than 5.000 years ago. The pyramid was built out of more than two million blocks of stones. The pyramid took over 20 years in building and needed much manpower which was divided into four construction teams. [6]
However, modern project management did not begin until 1900s when the Gantt chart was created. It was Henry Gantt and Fredrick Taylor that designed a graphical method to plan and control a work schedule and recording its progress. Over the years Gantt charts have been used, for example in 1931 when Hoover Dam was being built. It is still in use today because the chart can be easily understood. [6]
Furthermore, in 1956 the CPM was used to deal with the interrelationships of separate tasks in a project schedule. The Dupont chemical company and Remington Rand Univac, a computer firm, thought up the method because they had a joint venture. However, it was not until 1958 that the method was first tested. It was on a construction project of a new chemical plant. The CPM was then used again in 1959 to shutdown a plant in Louisville, Kentucky. [6]
Independent of the CPM, in 1958, the U.S Navy’ Special Projects Office, along with Lockheed Missile System and Booz Allen & Hamilton developed PERT for a missile program called Polaris. The reason why the U.S. government wanted to develop the tool was to ensure that the Polaris program was completed. Also, the U.S. government had concerns about the number of nuclear weapons which the Soviet Union was manufacturing. CPM and PERT both were designed to deal with the relationship between tasks in a project. However, PERT aimed to control over 3.000 contractors on the missile program but really the tool showed visually the major tasks and their relationship. As for the difference in function of the methods, PERT just showed the time interval but did not tackle the cost and quality issues faced by commercial firms. [6]
Improvements of the CPM
Since the development of the CPM, a couple of improvements have been made on it. First there was the Theory of Constraints which was formulated in the 1980s by the physicist Eliyahu Goldratt. [6] The theory is a methodology to analyse which factor is most likely to cause delay and then to improve that factor until it is no longer a bottleneck. [7] Then in 1997 the concept of the Critical Chain was introduced by Goldratt, when he published a book with that name. This improved method says to keep a project on schedule, it is necessary to emphasize on its resources and the flexibility required in the resources. Also, the method adds uncertainty buffers to the project schedule so it can be ready for unpredictable problems which may arise. [6]
Definitions
To be able to understand the CPM it is necessary to define some key concepts. In a project there are couple of paths, which are a sequence of connected tasks from the beginning of the project until the end. The sum of the time, which the tasks in the path take, is the length of the path. [5] The longest sequence of tasks, which has to be completed so a project can be finished, is the critical path. Hence, a task on the critical path cannot begin before its predecessors have been completed. Therefore, if there is a delay in one of the tasks, which are on the critical path, the project will also delay. [8] A project can have more than one critical path but all critical paths, in a project, have the same length. [5] Later in the article, will be shown an example of a critical path.
To find the earliest and latest schedules to avoid delays in the project are crucial. Hence, the following information is calculated for each task in the project. [5]
• The earliest start time (EST) which means the earliest time a task can start if there will not be a delay in the project.
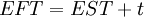
• The earliest finish time (EFT) indicates the earliest time a task can end if there will not be a delay in the project.
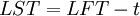
• The latest start time (LST) means the latest time a task can start if there will not be a delay in the project.
• The latest finish time (LFT) is the latest time a task can finish if there will not be a delay in the project.
The Critical Path Method

Before starting to use the CPM it is crucial to make a chart. The first thing is to list all tasks in the project. In the list it is needed to specify the task, the description, predecessors and the estimated time. Then, make a graph with notes, indicating each task, and arrows which indicate the connection between them. All arrows go from left to right and they begin at the first task, which has no predecessor, and go all the way to the last task, which has no successor. [9] The notes have to include space for the EST, EFT, LST, LFT and slack, as shown in Figure 1. When the graph has been made the CPM can be computed.
The CPM depends on EST, EFT, LST and LFT. The EST and EFT are calculated with a forward pass, but on the other hand the LST and LFT with a backward pass. In the forward pass a time is computed from the starting task to the finish one. As for the backward pass it is gone from the finish task to the starting one. How this is done will be explained in the upcoming paragraphs and an example taken in the next section. [5]
The basic of a forward pass is that all the predecessors connected to the task must be finished before it can begin. Let t be duration of a task and then it is possible to calculate EFT, with equation 1, for each task if there is no delay. [5]
-
 Equation 1
As a result from the equation above the EFT of the latest task is the EST for the next, called the EST rule. This will be shown below in the example section. The forward pass may be formulated as follows: [5]
1. All tasks which have no predecessor get EST = 0.
2. All tasks which have known EST, compute EFT using Equation 1.
3. Apply the EST rule to get EST for next task.
4. Repeat step 2 and 3 until all tasks have EST and EFT.
The basic of a backward pass is a task that can begin at the latest time if and just if all its predecessors are finished, it is called the LFT rule. Therefore, each task has the latest finish time equal to the shortest latest start times of the task which follows. Hence, the latest start time can be computed from equation below, if there is no delay in the project. [5]
 Equation 2
The backward pass starts when the EFT for the last task has be found with the forward pass and then calculated from the end task to the first task. The backward pass can be formulated as follows: [5]
1. Set LFT equal to EFT at the finish task and at all tasks which do not have successors.
2. For all tasks where LFT value is known, compute LST using Equation 2.
3. The LST from the successor becomes the LFT for every new task, the LFT rule.
4. Repeat step 2 and 3 until all tasks have LFT and LST.
The length of time which do not delay a project is the slack time. It is necessary to calculate the slack time to identify the critical path(s), either with the start times or the finish times. If the slack time is equal to zero the task is part of a critical path. This can be done with following equations: [5]
 or
or  Equation 3
Example of CPM
As mentioned in the section above, here will be taken an example with the CPM. In the example, the critical path will be found and the duration of the project. In reality the project manager would list the tasks, its predecessor and duration of each task. However, in this case that has already been done in the table below.
| Task | Predecessor | Time |
| A | – | 4 |
| B | A | 5 |
| C | A | 5 |
| D | B | 6 |
| E | B, C | 5 |
| F | D | 4 |
| G | F, E | 5 |
First of all draw a diagram, then the procedure of the project becomes visual. Also, it becomes easier to calculate the EST, EFT, LST, LFT and the slack for each task. Therefore, the diagram for this specific project will be:

Then, start to calculate EST and EFT for each tasks starting on the first task until all EST and EFT have been computed, by using Equation 1. Here it is good to remember that the EST for the first task, here task A, equals 0 and the EST of the successor is the EFT of the task before. If the task depends on two previous tasks the EFT which is higher is chosen.

When forward pass has been applied it can be seen that the total duration of the project is 24 weeks. To find the critical path, it is necessary to find the LST and LFT. To do so, the backward pass is used. Task G has the EFT = 24 therefore LFT = 24, as explained in the method section. When that is known, equation 2 can be applied to find LST and LFT for each task. Remember that LFT is equal to the LST of the successor. If the task has two or more successors the lowest number is chosen.

Now, the slack of each task is found by using Equation 3. In the diagram the slack is marked in red.

From the diagram above it can be seen that the critical path is the path A-B-D-F-G, since tasks C and E both have 1 in slack. To sum up the solution, the forward pass gave the solution of the project time, which was 24 weeks, and when finished applying the backward pass and slack the critical path was found, which was A-B-D-F-G.
CPM's advantages
All methods have pros and cons and the CPM is no exception of that. Hence, to be able to fully understand and use the method it is necessary to list the advantages. The advantages of the CPM are:
1. Helps finding out how the time schedule for tasks should look like according to their relation. [10]
2. Controlling of a project becomes easier for the management. [10] Because the CPM diagram shows visually the relation between tasks and therefore managers can seen how the project progresses.
3. Identifies the critical tasks in a project. Hence, it shows the management which tasks should be observed closely. [10] The CPM identifies where no slack is in tasks of a project and, therefore, does the method also identify which tasks the managers should watch closely.
4. Possible to become more detailed in planning of a project. [10] When all tasks are listed it is easier to know what is needed and what has to be done both for each task and the project as a whole.
5. Motivates the manager to shorten the time of the project. The manager can do so by optimize the critical path and use compression techniques. [11]
6. Enhances visibility of changes’ impact in a schedule, which almost always needs to be done in reality. [11]
CPM's limitation
As with the advantages, to use the CPM properly it is necessary to know the gaps in the method. Then it is possible to respond to them accordingly. The CPM has the following limitations:
1. Assumes that accurate duration of each task in a project is known. In real life that may not be true. [10] In practice it is very unlikely that the project manager can determine the precise time which tasks of a project will take.
2. The estimated time is not based on statistical analysis. [10] Since, the duration of a task is estimation of time for each task, the estimation can be wrong and a task can take a longer or shorter time to be finished.
3. For large projects, which have many tasks, it can be hard to print the project diagram and hang it on the wall. Also, in those cases it would be almost in possible to map the relationships. Hence, now software is used to do so. [11]
4. In some cases controlling a project can be difficult, since there can be many tasks in a project and a delay can change the whole diagram. [10]
Program Evaluation and Review Technique
When the period of a task is uncertain the CPM cannot be used. However, in those cases PERT analysis can be applied [5]. When the method is computed it is necessary to use a diagram, corresponding to the CPM diagram. Then, from the diagram the critical path can be computed and used later on in the calculations. The PERT analysis depends on three types of estimated duration for a task, as in CPM there is only single value [5]:
1. The optimistic duration a indicates the time which a task will take under the best conditions.
2. The pessimistic duration b means the time which a task will take under the worst conditions.
3. The most likely duration m is the time which is the most realistic for a task to be completed. Under normal condition this is the time the task will take.
Hence, the period of a task is assumed to have a beta probability distribution in the analysis. From the variables above the expected activity time,  , and the variance of the task completion time,
  , can be calculated as follows: [5]
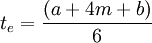 Equation 4
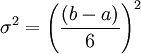 Equation 5
From the equations above the expected completion time of the project,  , can be obtained and the variability in the project completion time,
  , as follows: [5]
 Equation 6
 Equation 7
PERT analysis provides answers for question about the critical path(s), the beginning and finish times of tasks, project’s expected completion time and it takes in to account variability of the completion time for the project. Furthermore, estimates whether or not the project will be on time. Also, the analysis can estimate, with a given probability, how long the completion time is in the project. [5]
Example of PERT
The example which was used for the CPM is also used in this example. The time from the CPM example is shown as the normal time, m, and as before the project manager have already put in the integers, as shown in the table below.
| Task | Predecessor | Time | ||
| Opt. (a) | Normal (m) | Pess. (b) | ||
| A | – | 2 | 4 | 6 |
| B | A | 3 | 5 | 9 |
| C | A | 4 | 5 | 7 |
| D | B | 4 | 6 | 10 |
| E | B, C | 4 | 5 | 7 |
| F | D | 3 | 4 | 8 |
| G | F, E | 3 | 5 | 8 |
First of all, the expected activity time, , is calculated with Equation 4. When the expected time have been computed the diagram is drawn. Then, the table will be:
| Task | Predecessor | Time | Mean | ||
| Opt. (a) | Normal (m) | Pess. (b) |
| ||
| A | – | 2 | 4 | 6 | 4 |
| B | A | 3 | 5 | 9 | 5.33 |
| C | A | 4 | 5 | 7 | 5.17 |
| D | B | 4 | 6 | 10 | 6.33 |
| E | B, C | 4 | 5 | 7 | 5.17 |
| F | D | 3 | 4 | 8 | 4.5 |
| G | F, E | 3 | 5 | 8 | 5.17 |
Next, a diagram is drawn and the critical path is found with the expected task time, . That is done with the forward pass and the backward pass from the CPM, so please look at that for further demonstration. When CPM have been applied the diagram will have the critical path which can be seen with the green arrows.

Now, with Equation 5 compute the variance of the task completion time, , and add it to the table.
| Task | Predecessor | Time | Mean | Variance | ||
| Opt. (a) | Normal (m) | Pess. (b) | |
| ||
| A | – | 2 | 4 | 6 | 4 | 0.444 |
| B | A | 3 | 5 | 9 | 5.333 | 1 |
| C | A | 4 | 5 | 7 | 5.167 | 0.25 |
| D | B | 4 | 6 | 10 | 6.333 | 1 |
| E | B, C | 4 | 5 | 7 | 5.167 | 0.25 |
| F | D | 3 | 4 | 8 | 4.5 | 0.694 |
| G | F, E | 3 | 5 | 8 | 5.167 | 0.694 |
When the variances have been calculated the expected completion time of the project, , is obtained along with the variability of the project, . Remember that the critical path was found in example CPM, was A-B-D-F-G. Create a new table which only has the tasks in the critical path.
| Task | Predecessor | Time | Mean | Variance | ||
| Opt. (a) | Normal (m) | Pess. (b) | |
| ||
| A | – | 2 | 4 | 6 | 4 | 0.444 |
| B | A | 3 | 5 | 9 | 5.333 | 1 |
| D | B | 4 | 6 | 10 | 6.333 | 1 |
| F | D | 3 | 4 | 8 | 4.5 | 0.694 |
| G | F, E | 3 | 5 | 8 | 5.167 | 0.694 |
Then, Equation 6 is used to calculate the expected completion time of the project, .

Lastly, with Equation 7 the variability of the project, , is calculated.

From the equations above it can be seen that expected completion time of the project is 25.333 weeks and the standard deviation is 1.958 weeks. Therefore, it is 68.2% probability that the duration of the project will be in the range of 23.375 weeks to 27.291 weeks.
PERT's advantages
Before practicing a method it is necessary to know the method's advantages. When the advantages are known the calculation and solution will be understandable and the usage of the method will be easier. PERT is no exception of that and therefore some of PERT's advantages have been listed below.
1. Makes the management think carefully if the various tasks are pertinent for the project. [12] Since, the project manager has to estimate what time interval each task takes he is able to determine if a task is suitable for the project.
2. Makes it possible to predict time of a project. [13] Because the method depends on three different types of duration times it is more likely that the duration will be estimated correctly.
3. Finds the probability of the duration, both for each task and the whole project, and therefore enable determination of that. [12]
4. Helps coordinate various tasks in a project. [12] Because the PERT diagram shows visual the relation between tasks and therefore managers can see where the project are in the process.
PERT's limitation
All methods have some limits and the PERT are no exception of that. To know them is crucial to be able to see the gaps in the method and respond accordingly. In this section PERT's limitations will be demonstrated.
1. Depends on that all tasks are known beforehand. In some projects, such as in research and development, that is not possible. [12] When the complexity of a project is not fully understood in the beginning of a project, it is impossible to know which tasks are necessary for a project.
2. Assumes that tasks can be sub-divided into pre known and separate tasks, but in reality this is not always possible. [12]
3. Only takes into account time but not cost. Therefore, the method can choose expensive task, which takes shorter time then its cheaper counterpart. [12]
4. The duration of each task is estimates therefore it may be an error in the estimated time. [12]
5. Requires frequent updating and recalculating, which is expansive and time consuming. Because of the updating and recalculations there is need for highly trained staff. [12]
. Depends on that relationships between tasks should be known beforehand. As mentioned above, all tasks cannot always be known before a project starts therefore the relationships of those tasks cannot be known. Also, some tasks are difficult to put on one particular place. [13]
7. Focuses too much on the critical path but not the other tasks, which are not a part of the critical path. Hence, the tasks, which are not critical, may be forgotten in the process. [13]
8. Depends on that the time follows Beta PB but that is not necessarily true in reality. [13]
How PERT builds upon CPM
Now, the article has gone through both the CPM and PERT. From that it can be seen that they are closely connected, have similar methodology. They both begin by creating a diagram, which indicates connections between tasks in a project. As mentioned above, to use PERT it is necessary to find the critical path first. That can be done by using the forward pass and the backward pass, as is done with CPM. When the critical path has been computed PERT can be applied. Hence, in someways it can be said that PERT builds upon CPM, because it uses forward and backward pass to calculate the critical path. As shown with the examples, where the critical path from the CPM example was used to start the example for PERT.
Annotated bibliography
Anon. (n.d.) Project Scheduling: PERT/CPM. Retrieved 08.09.2016 from http://learngroup.org/uploads/2015-01-02/Lecture_-_Project_Management_%28Overview%29.pdf
A chapter which describes the role and application of CPM and PERT for projects. Introduces diagrams which helps computing the completion time of a project both with CPM and PERT. Also, goes through an example, using both methods.
Kalpana R. (n.d.) (PERT): Origin, Methodology, Advantages and Limitations. Retrieved 14.09.2016 from http://www.businessmanagementideas.com/business/pert-origin-methodology-advantages-and-limitations/535
An article which goes step by step through the PERT method. Also, some advantages and limitations are listed.
DK Sinha. (n.d.) Critical Path Method (CPM): Definition, Advantages and Limitations. Retrieved 14.09.2016 from http://www.yourarticlelibrary.com/business/planning-business/critical-path-method-cpm-definition-advantages-and-limitations/40754/
An article which defines what CPM is, its advantages and limitations.
Reference
- ↑ CareerProfile.info. (n.d.) The Project Management Interview. Retrieved 08.09.2016 from http://www.careerprofiles.info/project-management-interview.html
- ↑ Anon. (n.d.) Project Scheduling: PERT/CPM. Retrieved 08.09.2016 from http://www.math.csusb.edu/faculty/prakash/611/Project_Management.ppt.pdf
- ↑ Thompson, Scott. (n.d.) Characteristics of the Critical Path Method. Retrieved 08.09.2016 from http://smallbusiness.chron.com/characteristics-critical-path-method-66136.html
- ↑ Business Dictionary. (n.d.) critical path method (CPM). Retrieved 08.09.2016 from http://www.businessdictionary.com/definition/critical-path-method-CPM.html
- ↑ 5.00 5.01 5.02 5.03 5.04 5.05 5.06 5.07 5.08 5.09 5.10 5.11 5.12 5.13 5.14 Anon. (n.d.) Project Scheduling: PERT/CPM. Retrieved 08.09.2016 from http://learngroup.org/uploads/2015-01-02/Lecture_-_Project_Management_%28Overview%29.pdf
- ↑ 6.0 6.1 6.2 6.3 6.4 6.5 Kielmas, Maria. (n.d.) History of the Critical Path Method. Retrieved 14.09.2016 from http://smallbusiness.chron.com/history-critical-path-method-55917.html
- ↑ Vorne Industries Inc. (n.d.) WHAT IS THE THEORY OF CONSTRAINTS? Retrieved 14.09.2016 from http://www.leanproduction.com/theory-of-constraints.html
- ↑ Business Dictionary. (n.d.) critical path. Retrieved 14.09.2016 from http://www.businessdictionary.com/definition/critical-path.html
- ↑ Mind Tools Editorial Team. (n.d.) Critical Path Analysis and PERT Charts. Retrieved 14.09.2016 from https://www.mindtools.com/critpath.html
- ↑ 10.0 10.1 10.2 10.3 10.4 10.5 10.6 DK Sinha. (n.d.) Critical Path Method (CPM): Definition, Advantages and Limitations. Retrieved 14.09.2016 from http://www.yourarticlelibrary.com/business/planning-business/critical-path-method-cpm-definition-advantages-and-limitations/40754/
- ↑ 11.0 11.1 11.2 Sharma, Rupen. (Updated: 29.06.2015) Advantages and Disadvantages of Critical Path Method. Retrieved 14.09.2016 from http://www.brighthubpm.com/project-planning/60960-advantages-and-disadvantages-of-critical-path-method/
- ↑ 12.0 12.1 12.2 12.3 12.4 12.5 12.6 12.7 Kalpana R. (n.d.) (PERT): Origin, Methodology, Advantages and Limitations. Retrieved 14.09.2016 from http://www.businessmanagementideas.com/business/pert-origin-methodology-advantages-and-limitations/535
- ↑ 13.0 13.1 13.2 13.3 All Syllabus. (n.d.) Advantages and Limitations of PERT/CPM. Retrieved 14.09.2016 from http://www.allsyllabus.com/aj/note/Computer_Science/Operations%20Research/Unit6/Advantages%20and%20Limitations%20of%20PERT%20CPM.php#.V9qsfJh9600