Internal rate of return (IRR)
The Internal Rate of Return (IRR) is a powerful discounted cash flow method used in capital budgeting and corporate finance to estimate and evaluate the profitability of potential investments. Keeping in mind the formula for the Net present value (NPV), the IRR is defined as the discount rate that makes the present value of the costs (negative cash flows) of an investment equal to the present value of the benefits (positive cash flows). In other words, the IRR is the discount rate that gives a net present value of zero when applied to the expected cash flow of a project. This rate of return is called internal because the formula predicts a rate that depends only on the project, more precisely on the project's cash flows, and does not depend on external factors such as market interest rates or inflation [1]. One of the main advantages in using the internal rate of return to evaluate project investments, compared to other methods such as the Payback period or the Benefit-cost ratio, is that IRR considers the time value of money[2]. In general, due to the relationship between NPV and IRR, the higher the Internal Rate of Return of a project, the more desirable the investment to be made. This article shows also the limitations of the internal rate of return; however, when the IRR is unique, it provides relevant information about the return on investment and is also used as a measure of investment efficiency. In fact, according to academic research [3], three-quarters of Chief Financial Officers (CFOs) use the IRR method to evaluate capital projects.
Contents |
Big Idea
Relevance of Internal Rate of Return

Managers often have to decide on whether or not to authorize investment in a project, or they can also be asked to decide among different project options. Their final decision depends on many factors such as the project feasibility, the costs, the probability to finish the project on time, the technical and commercial risks, the tangible and intangible benefits [5]
In a typical project lifecycle, there are some costs associated with running the project and, then, hopefully, there are some benefits that represents the value of doing the project. Are the associated costs worth the investment based on the potential future value generated?
According to APM standard [4]: "the business case provides justification for undertaking a project programme or portfolio. It evaluates the benefit, cost and risk of alternative options and provides a rationale for the preferred solution".
--- Effective project organizations focus their limited resources on the best projects, declining to do projects that are good but not good enough. Figure XX is a funnel that connects strategic planning to the execution of projects, making the strategic objectives executable. The purpose of the funnel is to select only those projects that meet certain criteria and to say “no” to the others. The resulting collection of projects is a focused, coordinated, and executable portfolio of projects that will achieve the goals of the organization.PPfM complements project and program management. It aims the organization in the right direction by selecting the best projects to do. The selected projects are turned over to program and project management, which is the engine that initiates and completes them successfully.
The Project Management Institute (PMI) [6] defines the five primary steps of project, programme and portfolio management for selecting, prioritizing, and coordinating projects to increase value to an organization.
1. Clarify business objectives 2. Capture and research requests and ideas 3. Select the best projects using defined differentiators that align, maximize, and balance 4. Validate portfolio feasibility and initiate projects 5. Manage and monitor the portfolio
--- In the Clarify business objectives step the focus is on choosing the right direction. you must be able to clearly state your organization’s strategic objectives before starting portfolio management. This is often the first obstacle people run into when trying to implement PPfM. If you can’t determine the strategic objectives, stop working on portfolio management and fix that problem first.Portfolio management requires a systematic method of differentiating between candidate projects to determine which ones are “best.” What does “best” mean? The definition is unique to every organization. For example, one company might value environmental stewardship most highly, while another places top priority on ROI. Select a critical few criteria that will measure each project’s true value to your unique organization. Rigorously limit the number of criteria to four to ten to keep the amount of data manageable. The right criteria are essential because poor criteria will lead you to select the wrong projects.
--- Metrics that measure financial business value include:
▶ Cost-benefit ratio. This is a measure of the expected present value of an investment with the initial cost. The cost-benefit ratio is used to determine if the costs of a project outweigh its benefits. If the costs are greater than the benefits, the result will be greater than 1.0. In this case, the project should not be considered unless there are regulatory, social good, or other reasons to do the project. A similar measure is a benefit-cost ratio. The same measures are used, but the benefits are in the numerator and the costs are in the denominator. For this measure, if the ratio is greater than 1.0, the project should be considered. ▶ Planned benefits delivery compared to actual benefits delivery. As part of a business case, organizations may identify value as the benefit that will be delivered as a result of doing the project. For projects that expect to deliver benefits during the project life cycle, measuring the benefits delivered and the value of those benefits, then comparing that information to the business case, provides information that can justify the continuation of the project, or in some cases, the cancellation of the project. ▶ Return on investment (ROI). A measure of the amount of financial return compared to the cost, ROI is generally developed as an input to the decision to undertake a project. There may be estimates of ROI at different points in time across the project life cycle. By measuring ROI throughout the project, the project team can determine if it makes sense to continue the investment of organizational resources. ▶ Net present value (NPV). The difference between the present value of inflows of capital and the present value of outflows of capital over a period of time, NPV is generally developed when deciding to undertake a project. By measuring the NPV throughout the project, the project team can determine if it makes sense to continue the investment of organizational resources. ▶ Internal Rate of Return (IRR). DEFINITION
There are two main approaches to define valuation criteria based on the consideration of the time value of money:
1. Discounted methods take into account the time value of money () 2. Non-discounted methods do not take into account the time value of money
Time value of money
The first category listed above takes into account the time value of money. If it is needed to compare the cash flows available at different times, it is also needed to include the time value of money, which states that there is a difference between the future value and the present value of the same amount of money. So, to know the discounted cash flows of the project, therefore, it is necessary to discount the future cash flows through the discounting process. The reverse process, to be able to compare cash flows in the future, is called compounding [7]. In short, time is money hence having $ 100 today is different from having $ 100 tomorrow, and this paragraph explains why.
The monetary value of project investment is the value of the project's future cash flows (or net benefits) less the required investments (or initial costs). A key consideration regarding discounted cash flow methods is the Time Value of Money (TVM). In finance, an amount of money available today or in the future has a different value because we have to consider that also time has a monetary value. In other words, $ 100 today is not $ 100 tomorrow. The reason is that today you have the opportunity to invest money and thus grow, according to the time horizon and the interest rate. Another reason for the time value of money is the purchasing power of money which changes over time due to inflation or deflation [8]. Hence, time has a monetary value and we have to consider it if we want to compare money available in different moments. It is, therefore, necessary to briefly underline three fundamental terms about investments to clearly understand the time value of money:
- The Present value PV: the sum of money available today that can be invested [$];
- The Interest rate (or opportunity cost if we decide not to invest) r: the amount of interest due per period, as a proportion of the amount deposited or borrowed [%]
- The Future value FV: is the value of a current asset (present value) at a future date based on an assumed rate of growth (interest rate) [$].
| Present to Future (compounding) | 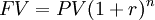
|
|---|---|
| Future to Present (discounting) | 
|
Example 1
Would you rather have $ 100,000 today or the same amount in 1 year from now?
To calculate how much money will be $ 100,000 in a year from now, supposing an interest rate r = 3%, we can apply the formula for the future value:

So having $ 100,000 now is equivalent to having $ 103,000 in the future considering an interest rate of 3%. If we agreed to receive $ 100,000 in one year instead of now, we would be $ 3,000 less. As shown, the present value and the future value differ by a factor of  ; this difference represents the time value of money. It can be concluded that to compare the money available in two different moments it is necessary to consider the time value of money, which allows us to discount money available in the future and consider it in the present or vice versa; only then can we compare the two amounts.
Example 2
After an initial investment of $ 100,000 for machinery, the management expects an annual future cash flows of $ 40 000 for the next 4 years thinking to gain $ 60 000 (-100 000 + 40 000*3) at the end of the 4-year period. Is it true?
In finance, to calculate the profitability of a project considering future cash flows, it is needed to consider an alternative investment with almost the same risk to know the interest rate of the other investment. Considering an interest rate r = 7%, we can now calculate the time value of money because we have the interest rate. So,
| cash flow (0) | cash flow (1) | cash flow (2) | cash flow (3) | cash flow (4) | |
| Today | - 100,000 | ||||
| 1st year | + 40,000 | ||||
| 2nd year | + 40,000 | ||||
| 3rd year | + 40,000 | ||||
| 4th year | + 40,000 |
Discounting all the cash flows with the PV formula:
We obtain:
| cash flow (0) | cash flow (1) | cash flow (2) | cash flow (3) | cash flow (4) | Time value of money | |
| Today | - 100,000 | 0 | ||||
| 1st year | + $ 37,383 | + 40,000 | - $ 2,617 | |||
| 2nd year | + $ 34,938 | + 40,000 | - $ 5,062 | |||
| 3rd year | + $ 32,652 | + 40,000 | - $ 7,348 | |||
| 4th year | + $ 30,515 | + 40,000 | - $ 9,485 | |||
| Total cash flow (0) | = $ 35,488 | = - $ 24,512 |
We can suggest to the management that the investment is profitable because the total cash flow (0) (first column), or Net Present Value, is greater than zero ($ 35,488). However, it is lower than the expectation ($ 60,000) because of the time value of money. In fact, $ 60,000 - $ 24,512 = $ 35,488
From this example, it may be useful to note that:
- The Net Present Value is the present cash flow of the project and it is obtained by discounting the cash flows;
- The difference in value between future and present cash flows (time value of money) is inversely proportional to time and the interest rate. This means that the more a cash flow is in the future, the more its value will decrease if it is to be carried over into the present [9].
Understanding the Internal Rate of Return
A good understanding of the methodological basis of Net Present Value is required to truly comprehend the essence of the internal rate of return method, as it is closely related to NPV and allows management to add valuable information on decision criteria rather than just look at NPV.
Net Present Value
Net Present Value is a discounted cash flow method used to analyze the profitability of a project and is the difference between the present value of cash inflows and the present value of cash outflows over a period of time [10]. To calculate the NPV of a project with future cash flows, it is necessary to discount them considering the time value of money. The NPV is the sum of these discounted cash flows and reflects the profitability of the project [11].
Mathematically:
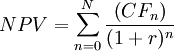
- n: current year
- N: time horizon
- CF (n): cash flow relative to n-year
- r: discount rate
The NPV of an investment project reflects in monetary terms the project profitability. Analyzing the formula for NPV it can be concluded that, according to the discount rate (r) considered in the formula:
- if NPV > 0: the discounted inflows are higher than the discounted outflows, hence the investment project will generate profit;
- if NPV < 0: the discounted inflows are lower than the discounted outflows, hence the investment project will generate loss;
- if NPV = 0: the discounted inflows are equal to the discounted outflows, hence the investment project will not generate profit or loss.
It is useful to observe that as the discount rate increases, the NPV decreases, and vice versa. Shortly, they are inversely proportional as shown by the graph above. [12]
Example
Suppose that management want to know the expected rate of return on their company's investment in the new project over the 5-year period. The investment consists of buying 10 new lathes for $ 50,000 each, supposing an annual inflow of $ 10,000 for the first, second and third year, $ 15,000 for the 4th and 5th years. How much profit (or loss) can this project generate? Consider three different discount rates: r1 = 11%, r2 = 6%, r3 = 5%.
Using the formula for NPV:
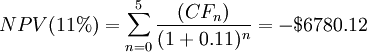
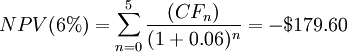
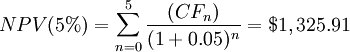
As expected, since the Net Present Value and the discount rate are inversely proportional, as one decreases, the other one increases. However, as shown by the example, as the discount rate changes, the value of the NPV also varies and therefore our decision to invest in the project can change.
The next paragraph is focused on the selection of the discount rate which is a crucial decision to decide if investing in a project or not, trying to answer these questions: what exactly is this rate? Are there any rules for determining the discount rate? How do I know if my decision is based on the correct discount rate?
Discount rate and WACC
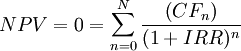
The internal rate of return is the discount rate that makes the net present value equal to zero. Therefore, an introduction to the role of the discount rate and its influence on the decisions of companies regarding project investments is necessary.
A company decides to invest in a project only if the expected revenues exceed the expected costs; in short, if the project is profitable. In the "Time Value of Money" paragraph we saw the importance of time in discounted cash flow analysis; we have also seen that the difference between future value and present value is due to the time value of money and for this reason, $ 100 today is not $ 100 tomorrow. The discount rate makes it possible to have an estimate of the present value of the project's future cash flows in a discounted cash flow analysis because it reflects the time value of money [13]. As shown in the last paragraph, the discount rate plays a key role in discounted cash flow analysis and can make the difference between deciding to invest in a project or not.
Deciding which discount rate to apply in a project investment decision is an important point. There is not a single way to determine the discount rate, it depends on the company. Conventional management theory suggests to use the weighted average cost of capital (WACC) as the discount rate to decide investments on new projects [14]. In situations where the new project is considered riskier than normal business operations, the discount rate will be equal to the average cost of capital to which an additional percentage is added which corresponds to a risk premium because there is a risk that future cash flows will be lower than expected [15].
Looking at the NPV formula, it can be seen that the net present value and the discount rate are inversely proportional. The problem is that there is not a unique correct method to decide which discount rate to use in the formula, and by changing this rate in the calculation, the NPV also changes and consequently the investment decision also changes. It would be useful to have a specific discount rate that allows management to understand the threshold between investing and not investing in a project. In the next section, we discuss this useful discount rate and how management can make decisions quickly using it.
Application
IRR decision criteria

Looking at the graph of the relationship between the net present value and the discount rate, it can be seen that as the discount rate increases, the net present value decreases. And this is intuitive because It is assumed that the discount rate is at least equal to the average cost of capital so that as the cost of capital increases, the profit will decrease, and, mathematically, the discount rate is in the denominator and as it increases, the net present value decreases. Furthermore, it can also be noticed that there is a particular discount rate, called the Internal Rate of Return, for which NPV is equal to zero and for each discount rate before the IRR, the net present value is higher than zero.
Hence, considering the weighted average cost of capital (WACC) as the minimum rate of return, it can be concluded that:
- If WACC < IRR (NPV > 0)
 the project is attractive
- If WACC > IRR (NPV < 0) the project should be rejected;
Because of the formula, the IRR is not easy to be calculated analytically and instead should be calculated iteratively or by using software, for example by Excel.
Example
Limitations
Hypothesys
Multiple IRRs
The first limitation related to the internal rate of return is that sometimes this rate is not unique and this problem is called multiple internal rates of return [17]. It happens when the positive and negative cash flows are more than one. With multiple IRRs, the single IRR decision criteria rule is no longer valid. How can multiple IRRs be in accordance with the project cash flows? The answer is that the maximum number of IRRs obtained equals the number of sign changes in the project's cash flows. This is why this method is very useful in projects where there is an initial investment, followed only by positive cash flows, and not useful in projects with many positive and negative cash flows.
[example...]
IRRs reinvested rate
The IRR reflects the profitability of a project, assuming that the profit of the project is reinvested at the same rate of profitability, which is the internal rate of return [17]. In practice occurs rarely because part of the profit is assigned to dividend, part is invested in another project that assumes less risk but at the same time is less profitable [16].
[continue...]
Annotated bibliography
[continue...]
References
- ↑ BERNHARD, Richard H. Discount methods for expenditure evaluation-a clarification of their assumptions. The Journal of Industrial Engineering, 1962, 13.1: 19-27.
- ↑ Haight, Joel M.. (2012). Principles of Industrial Safety - 5.2.5 Net Present Worth. American Society of Safety Professionals
- ↑ John R. Graham and Campbell R. Harvey, “The theory and practice of corporate finance: Evidence from the field,” Duke University working paper presented at the 2001 annual meeting of the American Finance Association, New Orleans.
- ↑ 4.0 4.1 APM Body of Knowledge 7t, 3.1.1 Business Case
- ↑ Lock: Project Management (10th Edition)
- ↑ Project Management Institute, Inc. (PMI). (2021). A Guide to the Project Management Body of Knowledge (PMBOK ® Guide) – 7th Edition and The Standard for Project Management. Project Management Institute, Inc. (PMI)
- ↑ Torries, Thomas F.. (1998). Evaluating Mineral Projects - Applications and Misconceptions. Society for Mining, Metallurgy, and Exploration (SME)
- ↑ Runge, Ian Charles. (1998). Mining Economics and Strategy - 5. Time Value of Money. Society for Mining, Metallurgy, and Exploration (SME)
- ↑ Khatib, Hisham. (2014). Economic Evaluation of Projects in the Electricity Supply Industry (3rd Edition) - 5.3.3 Benefit/Cost Ratio. Institution of Engineering and Technology (The IET)
- ↑ Project Management: "Managing Successful Projects with PRINCE2" 6th Edition (2017)
- ↑ Mular, Andrew L. Halbe, Doug N. Barratt, Derek J.. (2002). Mineral Processing Plant Design, Practice, and Control Proceedings, Volumes 1-2 - 21.2.7 Sample Calculation of NPV and IRR. Society for Mining, Metallurgy, and Exploration (SME)
- ↑ Temizel, Cenk Tuna, Tayfun Oskay, Mehmet Melih Saputelli, Luigi A.. (2019). Formulas and Calculations for Petroleum Engineering - 7.28 Present Value of an Annuity. Elsevier
- ↑ Clar, Michael L. Traver, Robert G. Clark, Shirley E. Lucas, Shannon Lichten, Keith Ports, Michael A. Poretsky, Aaron. (2015). Low Impact Development Technology - Implementation and Economics - 6.6.4.3 Calculate Cost-Effectiveness. American Society of Civil Engineers (ASCE)
- ↑ Corporate Finance Institute. "WACC."
- ↑ CHRISTINA MAJASKI, CHARLENE RHINEHART, SUZANNE KVILHAUG (2022). Cost of Capital vs. Discount Rate: What's the Difference?
- ↑ 16.0 16.1 Mackevičius, Jonas ; Tomaševič, Vladislav. «Evaluation of investment projects in case of conflict between the internal rate of return and the net present value methods, 2010
- ↑ 17.0 17.1 Marko Miletic, Domagoj Latinac. Internal rate of return method - a commonly used method with few advantages and many disadvantages?