Kanban
Kanban is a systematical approach used to visualize, control, and measure the progress of tasks in a project. The word Kanban is rooted from the Japanese language and is the combination of the word kan meaning visual and ban meaning card. [1]
Kanban has its origin in the late 1940s when Toyota decided to put its efforts in the development of a production control system with the goal of shortening the time required from the start to the completion of a process. The Kanban system is a sign-based scheduling system that helped Toyota to improve production efficiency and eliminate waste, establishing the JIT (just-in-time) manufacturing system that is a central philosophy of Lean Thinking. In recent years the concept of Kanban got widely adopted especially as a project management tool for software development, but it can be applied to just about any industry, either process, production or task related.[2]
Contents |
Big Idea
The fundamental element in every Kanban is the visualization of work tasks as individual cards. The cards are moving from the left to the right side of the Kanban board. The second fundamental element in every Kanban is the board itself, whereas the columns indicate the different categories a task or card is. Classic Kanban boards are typically done in an analog version on paper or on whiteboards with sticky notes as cards moving through the system. More sophisticated Kanban boards are easier to set up digital, using software tools that offer a Kanban system solution. Regardless of the way the Kanban system is realized, it requires at a minimum level always a board that is filled with multiple cards that represent the work tasks that are either planned, in progress or already completed. [3]
Kanban Cards
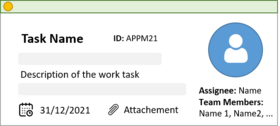
The centerpiece of every Kanban system is the visualization of a work task as a card. In a basic Kanban set up, every card must have at least a unique task name as well as a very brief description about the task itself, allowing other team members to identify and allocate the tasks in the Kanban board.
In addition to the task name, cards can include the names of the people collaborating and if needed the roles that they are assigned to. To keep track of multiple work items with different delivery dates, the due date of the task can be added, making it easier to prioritize and plan the tasks. In digital Kanban systems it is common to add relevant attachments to the task as well as assign unique ID numbers to the cards, making it easier to find and organize cards. The round circle on top of the left-hand side of the card is another optional item, whereas the color indicates the priority a card must be processed in the system. This indicator makes sure that high priority items do not get overseen and are processed with priority. By default, the prioritization of the cards is defined by the way they are stacked. High priority item are placed on top of the stack, while low priority tasks are moved to the bottom of a category in the board.
Kanban Board
The purpose of the board in a Kanban system is to categorize and visualize the stages a work item flows through over the period from its creation until it is completed. The format and name of the column titles in the board can vary depending on the field a project is conducted. It is important to note that the titles of the columns should look different for most projects, as e.g. physical production planning requires different procedures and work stages in contrast to a team using Kanban to manage work tasks in software development.
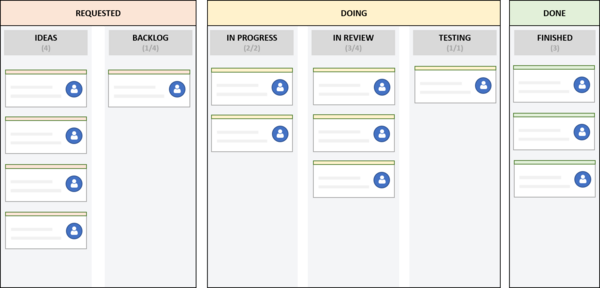
Regardless of its application, every Kanban board has the umbrella categories Requested, Doing and Done to classify the status of work tasks. If needed additional sub-categories can be added below the umbrella category, to further refine the board and adapt it to its preferred used case. The Kanban board in Figure 3 is an example how such a Kanban board might look like, with added sub-categories in the doing section indicating if a task is either In Progress, In Review or in the Testing stage.
New work tasks are created as cards and are put into the Kanban system on the left-hand side of the board in the Requested section. Over time, when the task is progressing, the card moves continuously through the categories until to completion on the right-hand side. The rules when a card can move from one stage to the next one is usually set by the project manager and must be clear to every team member, so everyone involved in the project can update the board once they completed a task.
Measuring Performance
Adding metrics to the Kanban system allows to capture the progress and measure project performance, making it possible to track and monitor the status of the tasks in the board. Assessing the metrics on a weekly, monthly, and yearly basis can help to analyze the impact of changes on the overall project performance. In the following paragraph the most relevant metrics that can be seen similar to Key Performance Indicator (KPI) are discussed. [4]
Work In Progress (WiP)
The Work in Progress (WiP) limit is added to the board to limits the number of simultaneous tasks allowed in the same category. In the Figure 3 the board shows the current number of cards and the WiP limit in gray colored numbers for each category. Categories like the Ideas or Done do not need a set WiP limit, as the purpose of these categories is sorely to collect the cards. An argument behind the WIP limit is that scientific studies have shown that multitasking heavily decreases productivity and cognitive ability. [5] By setting a WIP limit, fewer work tasks can be processed at the same time, encouraging team members to complete tasks before starting a new one. Setting a WiP limit helps as it results in an overall decrease of lead time for the work tasks, establishing a more agile task management. The WIP limits for each category should be defined for each project individually, as the number depends on the type of organization the system is used, the number of people working on a task together and the size and duration an average task takes to complete in the Kanban system.[4]
Lead Time
The lead time in the Kanban system is specified as the time a card spends from being placed in the Requested category until it reaches the Done category. Knowing the time, it takes to complete a standard task helps the team to better assign internal resources. Moreover, implementing more accurate forecasting practices based on the lead time helps to give customers or collaborators more precise estimations about the timeframe needed to complete certain tasks.[6]
Cycle Time
The cycle time defines the time a work task requires to go through a category in the Kanban board. The cycle time is a valuable metric to monitor as it provides the user with information how long one certain process step takes. In comparison to the lead time, the cycle times starts counting when someone in the team starts working on a task. It is desirable to keep the cycle times low in a Kanban system as it reflects that the team is working efficiently, resulting in a shorter lead time.[6]
Throughput
The throughput of the system is a valuable metric when using Kanban, as it measures all completely delivered work tasks within a certain timeframe. This metrics should ideally remain constant or increase, as this reflects a stable and increase of the overall performance of the team. The metric for the throughput can be derived from the Kanban board, as it is the summation of completed work items or cards. It is worth to mention that the throughput metrics only considers the finished items, any work that is still in progress is not counted.[4]
Interrelation of the Metrics - Little's Law
The Little’s Law is a mathematical equation coming originally from queuing theory linking the three basic flow metrics cycle time, lead time and throughput in a system. Changing two of the metrics in the formula WIP = Throughput • Cycle Time subsequently has an impact on the other two metrics in the system. The Little’ Law is the simplest method to make future predictions, thus as it is based on assumptions making possible predictions possibly inaccurate. If accurate forecasts are needed in the context of project management, the use of tools like the Cycle Time Scatterplot or Monte Carlo Simulation is advisable.[7]
Workflow Visualization with Cumulative Flow Diagrams (CFD)
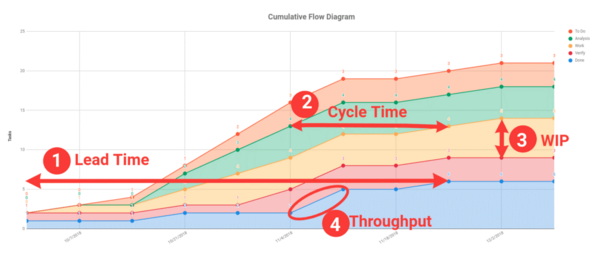
The Cumulative Flow Diagram (CFD) is a powerful way of visualizing the pace of project progress. As the name implies it provides a visual representation of how well a Kanban system flows. The CFD functions as the central dashboard to track project progress and changes in the workflow. The term flow is used in the Kanban system when speaking about measuring the progress of a work task. In the diagram the vertical axis represents the cumulative number of tasks while the horizontal axis represents the timeline. The curves inside the diagram are all representing the specific categories in the Kanban board, whereas it is the development of the curve over the time providing insights into additional information where and what types of tasks are progressing and identify possible bottlenecks in the system.

The different graphs in the Cumulative Flow Diagram provides the following exemplary insights:
- Well performing systems have lines with a constant and noticeable positive gradient
- Straight or lines with a small gradient are indicating no or only slow progress
- Space in-between lines that are categories next to each other in the Kanban board indicate WiP
- The done line represents a burn up and can be used for project planning and delivery forecasts
Further information about the possible shapes of CFD curves and what the curve implicitly tell about the workflow and processes inside the project team can be found on the project management platform Getnave.
Application of Kanban
Kanban in the Context of Project, Program & Portfolio Management
Project Management:
Program Management:
Portfolio Management:
Benefits & Limitations using Kanban
Benefits
Limitations
Kanban vs Scrum
Getting Started with Kanban
Implementation Rules
Kanban Software
References
- ↑ Klaus Leopold, Siegfried Kaltenecker (2015). Kanban Change Leadership – Creating a Culture of continuous Improvements. John Wiley & Sohns
- ↑ Dos Santos, Paulo Sérgio & Beltrão, Alessandro & Pedraça de Souza, Bruno & Travassos, Guilherme (2018). On the benefits and challenges of using kanban in software engineering: a structured synthesis study . Journal of Software Engineering Research and Development. 6. 10.1186/s40411-018-0057-1.
- ↑ Kanbanize. (2021). What Is a Kanban Board?. Available Online
- ↑ 4.0 4.1 4.2 Kanban Metrics. (2021). What to Measure and Why: Kanban Metrics. Available Online
- ↑ Kanbanzone. (2021). Why Multitasking Doesn’t Work – And How Kanban Can Help. Available Online
- ↑ 6.0 6.1 PMI (2017). Agile Practice Guide . Project Management Institute (PMI)
- ↑ CFD. (2021). How to Read a Cumulative Flow Diagram in Kanban. Available Online
Annotated Bibliography
"A Guide to the Project Management Body of Knowledge (PMBOK® Guide)" - Fundamental resource about the topic of project management. The book includes an "Agile practice Guide" that elaborates in detail on the use of Kanban as a core aspect of agile project management.
"Real-World Kanban: Do Less, Accomplish More with Lean Thinking" - User guide on how to facilitate and establish the correct Kanban system for different teams and applications
"Kanban Change Leadership: Creating a Culture of Continuous Improvement" - Linking the use of Kanban into the context of setting-up a system of continuous improvement for successful change management in an organization

