Kano Model: Introduction and Application
(→Analysis of Questionnaire Results) |
(→Analysis of Questionnaire Results) |
||
| Line 62: | Line 62: | ||
'''Better-Worse Analysis'''<BR> | '''Better-Worse Analysis'''<BR> | ||
| − | In addition to the discussion of the Kano Evaluation Table, we also can calculate the Better-Worse coefficient by the percentage of functional attributes classified, indicating a function can increase satisfaction or eliminate dissatisfaction. | + | In addition to the discussion of the Kano Evaluation Table, we also can calculate the Better-Worse coefficient by the percentage of functional attributes classified, indicating a function can increase satisfaction or eliminate dissatisfaction.<BR> |
| + | |||
| + | After implementing a new function/need, the satisfaction coefficient is Better/SI=(A+O)/(A+O+M+I).<BR> | ||
| + | After not implementing a new function/need, the dissatisfaction coefficient is Worse/DSI=-1*(O+M)/(A+O+M+I).<BR> | ||
===Matters Needing Attention=== | ===Matters Needing Attention=== | ||
Revision as of 22:41, 20 February 2022
Developed by Hai Hu-s212360.
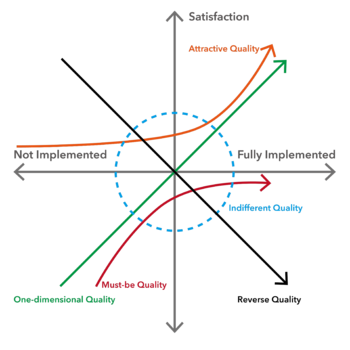
Kano Model (KANO model) is a useful tool for classifying and prioritizing user needs developed by a professor of the Tokyo University of Science named Noriaki Kano in the 1980s. In the product development and optimization process, the development team need to decide which customer needs should be solved first and how to create new functions for customers. Based on the analysis of the impact of user needs on user satisfaction, it reflects the nonlinear relationship between product performance and user satisfaction. By analyzing the user's satisfaction with product functions, the product functions are graded to determine the priority in the product implementation process. In the Kano model, the quality characteristics of products and services are divided into five types: (1) Must-be Quality/ Basic Quality; (2) One-dimensional Quality/ Performance Quality; (3) Attractive Quality/ Excitement Quality; (4) Indifferent Quality/Neutral Quality: (5) Reverse Quality(see Figure 1). The first three needs are classified according to performance indicators: basic factors, performance factors and incentive factors.[1]
The Kano Model is a typical qualitative analysis model, which is generally not directly used to measure user satisfaction but is often used to identify users' acceptance of new functions. It can effectively reduce the disagreements about customer needs between the project manager and developers. The Kano Model analysis method is mainly to conduct research through standardized questionnaires, classify the attributes of each factor according to the survey results, and solve the positioning problem of product attributes to improve customer satisfaction.
Contents |
History
Inspired by a behavioural scientist Herzberg's Two-Factor theory(1959)[2], Tokyo Institute of Technology professor Noriaki Kano and his colleague Fumio Takahashi published Motivator and Hygiene in Quality in October 1979. It was the first time the satisfaction and dissatisfaction standards were introduced into the field of quality management, and the research report "Attractive Quality and Must-be Quality" was read out at the 12th annual meeting of the Japan Quality Management Conference in 1982. The paper was officially published on January 18, 1984, in the Japanese Society for Quality Management (JSQC) magazine "Quality", No. 14, marking the establishment of the Kano model and the maturity of the attractive quality theory. In this paper, Noriaki Kano first proposed a two-dimensional model of satisfaction and constructed the KANO model. In Japan at the time, the issue of improving products and corporate services had always been a difficult problem. The model he proposed effectively solves this problem.
Customer preferences categories
Must-be Quality/ Basic Quality
It is also known as the necessary demand and the natural demand, which is the basic requirement of the customer for the product or service factor provided by the enterprise. An attribute or function that a customer considers a "must-have" product. When its characteristics are insufficient (not meeting customer needs), customers are very dissatisfied; when its characteristics are sufficient (satisfying customer needs), customers may not be satisfied. For basic needs, even if it exceeds the customer's expectations, the customer is satisfied at best and will not show more favourable feelings about it. However, as long as there is a little negligence and the customer's expectations are not met, customer satisfaction will plummet. For customers, these needs must be met, as a matter of course. For this type of demand, the company's approach should be to focus on not losing points in this regard. It requires the company to continuously investigate and understand customer needs, and reflect these requirements in products through appropriate methods.
For example, a smartphone with no signal, poor call quality, incompatible operating system, infected with a virus, no power after 10 minutes of standby time, and if the phone runs so slow that it's close to crashing, all of these will increase user dissatisfaction, but the above After these needs are met, it will not bring about an increase in user satisfaction, because users think that these are necessary.
One-dimensional Quality/ Performance Quality
Also known as willingness needs. It refers to the demand in which the satisfaction of the customer is proportional to the degree of satisfaction of the demand. If such demand is met or performed well, customer satisfaction will increase significantly. The more products and services provided by the company exceed customer expectations, the more satisfied customers are. The better the situation. When such needs are not met or perform poorly, customer dissatisfaction also increases significantly.
Still using mobile phones for example, if the customers can get phones with better cameras at the same price, the customers are more likely to be satisfied with the products.
Attractive Quality/ Excitement Quality
Refers to needs that will not be overly expected by customers. For attractive needs, with the increase in the degree of meeting customer expectations, customer satisfaction will rise sharply, but once satisfied, even if the performance is not perfect, the customer's satisfaction status is very high. Conversely, even when expectations are not met, customers do not show significant dissatisfaction. When customers do not express a clear demand for some products or services, the company provides customers with some completely unexpected product attributes or service behaviours to surprise customers, and customers will show great satisfaction, thereby increasing customer loyalty. . This kind of demand often represents the potential demand of customers, and the practice of enterprises is to find such demand and lead the opponent. For example, some well-known brand enterprises can regularly conduct product quality tracking and return visits, release the latest product information and promotional content, and provide customers with the most convenient shopping method. In this regard, even if other companies do not provide these services, customers will not show dissatisfaction.
Before the first generation of the iPhone was released by Steve Jobs, most people used Nokia mobile phones which could just make calls, send messages or take pictures. But when the iPhone came up, people first realized that a mobile phone should be like this. For that era, the iPhone means everything is possible.
Indifferent Quality/Neutral Quality
Whether it is provided or not, it has no impact on the user experience. are aspects of quality that are neither good nor bad, they do not lead to customer satisfaction or dissatisfaction.
Reverse Quality
Also known as reverse demand, it refers to quality characteristics that cause strong dissatisfaction and quality characteristics that lead to low levels of satisfaction, because not all consumers have similar preferences. Many users do not have this demand at all, and user satisfaction will decline after the provision, and the degree of provision is inversely proportional to the degree of user satisfaction. For example, some customers prefer high-tech products while others prefer ordinary products, too many extra features can cause customer dissatisfaction.
For example, some customers prefer high-tech products while others prefer ordinary products, too many extra features can cause customer dissatisfaction.
The Kano Model analysis method
The KANO model analysis method is mainly to conduct research through standardized questionnaires, classify the attributes of each factor according to the survey results, and solve the positioning problem of product attributes to improve customer satisfaction.
Method Steps
1. Recognize product or service needs from the customer's perspective;
2. Design a Questionnaire;
3. Implement effective questionnaires;
4. Categorize survey results to build quality models;
5. Analyze quality models to identify the sensitivity of specific qualities;
Questionnaire Design
1. Questions related to each user need in the KANO questionnaire have positive and negative questions. The difference between the positive and negative questions should be clear enough to prevent users from misunderstanding the questions:
2. In the questionnaire setting, if there are too many function points(more than 5), or the difference between the function points is not large, we need to group users, and each user should answer at most 5 function points.
3. Explanation of function: briefly describe the function point to ensure that users understand.
4. Options description: Since users have different understandings of "Like", "Must", "Neutral", "Live with", and "Dislike", it is necessary to give a unified explanation before filling out the questionnaire so that users have a relatively consistent standard and easy to answer.
Like: Make you feel satisfied, happy, surprised.
Must: Functions/services that you think are necessary and necessary.
Neutral: You don't particularly care, but it's acceptable.
Live with: You don't like it, but it's acceptable.
Dislike: Make you feel unsatisfied and unacceptable.
5. Add indicators that can be used for user analysis.
Analysis of Questionnaire Results
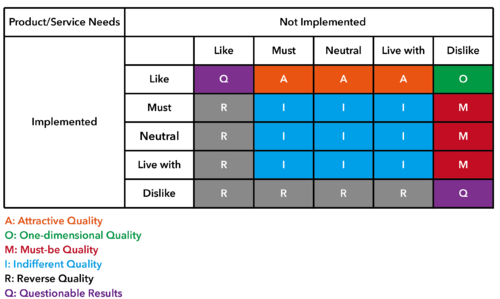
Kano Evaluation Table
Based on the combination of responses to the implemented and not implemented needs question the classification can be deduced (see Table 1). Questionable result answers are not taken into account during the evaluation.
Better-Worse Analysis
In addition to the discussion of the Kano Evaluation Table, we also can calculate the Better-Worse coefficient by the percentage of functional attributes classified, indicating a function can increase satisfaction or eliminate dissatisfaction.
After implementing a new function/need, the satisfaction coefficient is Better/SI=(A+O)/(A+O+M+I).
After not implementing a new function/need, the dissatisfaction coefficient is Worse/DSI=-1*(O+M)/(A+O+M+I).
Matters Needing Attention
1. Needs will vary from person to person.
We need to meet the needs of the majority of the target users.
2. Needs to vary by culture
3. Needs change over time[1]
Compare the iPhones and old Nokia phones. Before the iPhone came up, customers want a Nokia phone with better cameras, iPhone means a phone with many Excitement Qualities at that time. But today, Apple is optimizing the first iPhone and do not have many things new.
Application
References
- ↑ 1.0 1.1 Kano, Noriaki; Nobuhiku Seraku; Fumio Takahashi; Shinichi Tsuji (April 1984). "Attractive quality and must-be quality". Journal of the Japanese Society for Quality Control (in Japanese). 14 (2): 39–48. ISSN 0386-8230. Archived from the original on 13 August 2011.
- ↑ Herzberg, Frederick; Mausner, B.; Snyderman, B.B. (1959). The motivation to work (2nd ed.). New York: Wiley. ISBN 978-0-471-37390-2.

