Managing Projects with Earned Value Management
M vittoria (Talk | contribs) (→A simple example) |
M vittoria (Talk | contribs) |
||
| Line 19: | Line 19: | ||
===The concept=== | ===The concept=== | ||
===A simple example=== | ===A simple example=== | ||
| − | DTU is going through an architectural renovation project which involves, among | + | DTU is going through an architectural renovation project which involves, among other activities, replacing every outdoor dining table of the campus with new ones. A team has been assigned to this task and the plan is the following: |
[[File:chart.jpeg|right|'''FigureX'''Visual representation of the example]] | [[File:chart.jpeg|right|'''FigureX'''Visual representation of the example]] | ||
| − | * | + | *15 batches of 10 tables (150 tables in total) need to be installed |
*It is planned to install 3 batches per day (30 tables) | *It is planned to install 3 batches per day (30 tables) | ||
| − | *The budgeted cost per table | + | *The budgeted cost per table is 200 dkk. (total budget = 30,000 dkk) |
After the first day: | After the first day: | ||
*25 tables have been installed against the 30 which were planned. (The drilling machine broke down and caused delays). | *25 tables have been installed against the 30 which were planned. (The drilling machine broke down and caused delays). | ||
| − | *The Total Cost for the day was | + | *The Total Cost for the day was 6,800 dkk. This is because a new drilling machine has been rented and costs 1,800 dkk per day. |
Basic EVM calculations for the first day: | Basic EVM calculations for the first day: | ||
*Earned Value: 25 tables installed * 200 dkk/table installed = 5,000 dkk | *Earned Value: 25 tables installed * 200 dkk/table installed = 5,000 dkk | ||
Revision as of 09:30, 14 September 2016
Contents |
Abstract
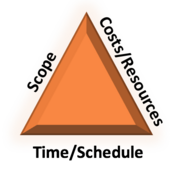
The management of technical projects has become a real challenge in an always more competitive market where effective project Planning and Control approaches need to comply with clients’ requirements. For successfully completing a project, this needs to both meet the technical objectives and be completed on schedule and within budget. This task involves comparing the actual situation with the planned one in terms of Scope, Time and Costs, which, together, form the Project Management Triangle. To guarantee that all project deliverables are achieved, it is very important that all three dimensions of project performance are monitored and controlled.However, if any of these dimension is analyzed without taking into account the other two, problems may arise, because only a partial overview of the project status would be provided. For instance, a project may be on budget whilst having accomplished less work than what was planned to be accomplished. On the other hand, a project may also be on budget while having accomplished more work than what was planned. In the first case the project is said to be behind schedule, while in the second case it would be ahead of schedule. How can time measurements be related to costs? And how can managers have an objective overview of the current state of their projects? To answer these questions an effective project control system should be created, to provide managers with timely and accurate information on deviations of costs and time measurements from the objectives established during the planning phase of the project.
This is where Earned Value Management (EVM) come into play by allowing for both schedule and cost analysis against the physical amount of work accomplished. Earned Value Management is a project management technique used for measuring, at any time, the progress and the integrated performance of a project in an objective way. It is an approach that effectively combines the scope of a project with time and costs parameters and allows alerting to deviations from budget and schedule baseline. In this way it can generate early warning signals to detect problems or to exploit new opportunities within the project. In other words, EVM compares the planned amount of work with what has actually been accomplished to determine whether costs, schedule, and work accomplished are progressing as planned or they are deviating form cost and schedule baselines.
With this methodology it is possible not only to see how a project is performing, but to predict future performance as well. In fact, it is also able to estimate the project completion date and final cost and to provide accurate forecasts of performance problems, which can be a fundamental contribution when managing a project.
Today, Earned Value Management is considered one of the most powerful techniques used in the management of complex projects in commercial, government or private environments. The purpose of this article is to provide the reader with a brief but effective guidance to the concept of EVM and to its application and implementation.
Background and purpose
Theory of Earned Value Management
The concept
A simple example
DTU is going through an architectural renovation project which involves, among other activities, replacing every outdoor dining table of the campus with new ones. A team has been assigned to this task and the plan is the following:
- 15 batches of 10 tables (150 tables in total) need to be installed
- It is planned to install 3 batches per day (30 tables)
- The budgeted cost per table is 200 dkk. (total budget = 30,000 dkk)
After the first day:
- 25 tables have been installed against the 30 which were planned. (The drilling machine broke down and caused delays).
- The Total Cost for the day was 6,800 dkk. This is because a new drilling machine has been rented and costs 1,800 dkk per day.
Basic EVM calculations for the first day:
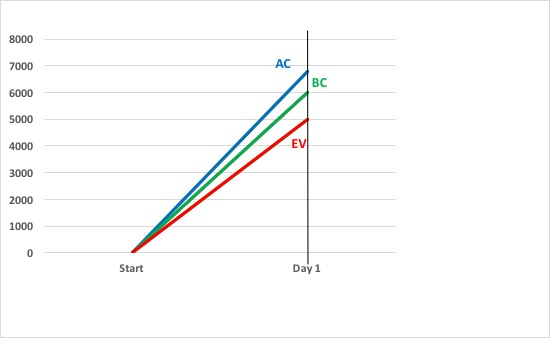
- Earned Value: 25 tables installed * 200 dkk/table installed = 5,000 dkk
- Budgeted Cost: 30 tables planned * 200 dkk/table planned = 6,000 dkk
- Actual cost: 25 tables installed * 200 dkk/table installed + 1,800 dkk for the machine = 6,800 dkk
A visual representation of these 3 parameters is shown in the diagram on the right.

