Metra Potential Method
The Potential Metra Method, or MPM, is a project management tool, invented in 1958 by French researcher Bernard Roy. MPM is used to describe, organize and plan the several tasks constituting a project development. This management method is similar to the PERT method. It consists of an oriented graph, whose summits represent tasks and the connections represent anteriority constraints. Thanks to the use of the MPM method, a critical path is identified easily by simply reading the chart, and the length of the critical path is represented directly.
Contents |
History
Invented in 1958 by French researcher Bernard Roy, the Potential Metra Method (MPM, for Méthode des Potentiels Metra in French) is based on the Graph Theory. This method was first created as a tool provided for a crank shafts factory called Mavilor. Very soon after its creation, MPM was used for the construction of the superstructures of cruise liner France. In the beginning of the 1960’s, this method was involved in the development of the airplane program Concorde, as well as in the construction of the first generation of nuclear plants in France.
Bernard Roy is a French researcher born in 1934, widely recognized as a pioneer in the field of operational research in France. His works form one of the foundations of scientific approaches to decision support.
Overview
Created the same year as the PERT method, the MPM method is a system of representation and optimization of project tasks. This method can be considered to be half-way between Gantt Graph and PERT representation. It allows the user to prioritize a large number of tasks, taking into account the anteriority constraints linking these several tasks.
The main goal leading to the creation of this new management method was to reduce the complexity of the Gantt chart, taking into account the dependency relationships between multiple tasks (precedence, inheritance, etc.) and also the evolution of these constraints along the time.
Similarly to the PERT method, the main benefit of MPM is to reduce the time required to achieve a project, but this method only takes into account the schedule aspects, deadlines, delays, etc… It cannot be used in the field of budget or resources management. By precisely describing the dependency between each task, MPM optimizes speediness of the process providing a graphical representation under the form of a network. Thus, all information related to a same operation are grouped under a single node, which facilitates the identification of the critical path.
Allowing an easy identification of the critical path, the MPM is used to determine the minimum time required to conduct a project. Moreover, this method affords to define the dates on which the various tasks involved in the project may or must begin to ensure that this minimum time is respected.
Implementation of the method
Terminology
Task: In the frame of project management, a task is the basic division of the work required to produce the result. The task evolves from an initial state to a final state. Each task has a duration and cost.
Previous task: A task which, with respect to another, has to be performed before.
Antecedent task: A task which is immediately prior to another task.
Stage: A step is the beginning or the end of a task. It has no time nor cost.
MPM grid: This is all of the tasks and stages that define the project. It highlights the relationships between tasks and stages.
Critical path: The longest possible continuous path from the initial task starting to the terminal task ending; it determines the total amount of time required for the project delivery. Any time delays along this path will delay the execution of the project by at least the same amount.
Float (or slack): A float is a measure of the available extra time and resources needed to complete a task. It indicates the possible delay that an individual task may have without delaying the all process.
Earliest start: It corresponds to the earliest date when the task may start.
Latest start: It corresponds to the latest date when the task may start.
Graphic representation
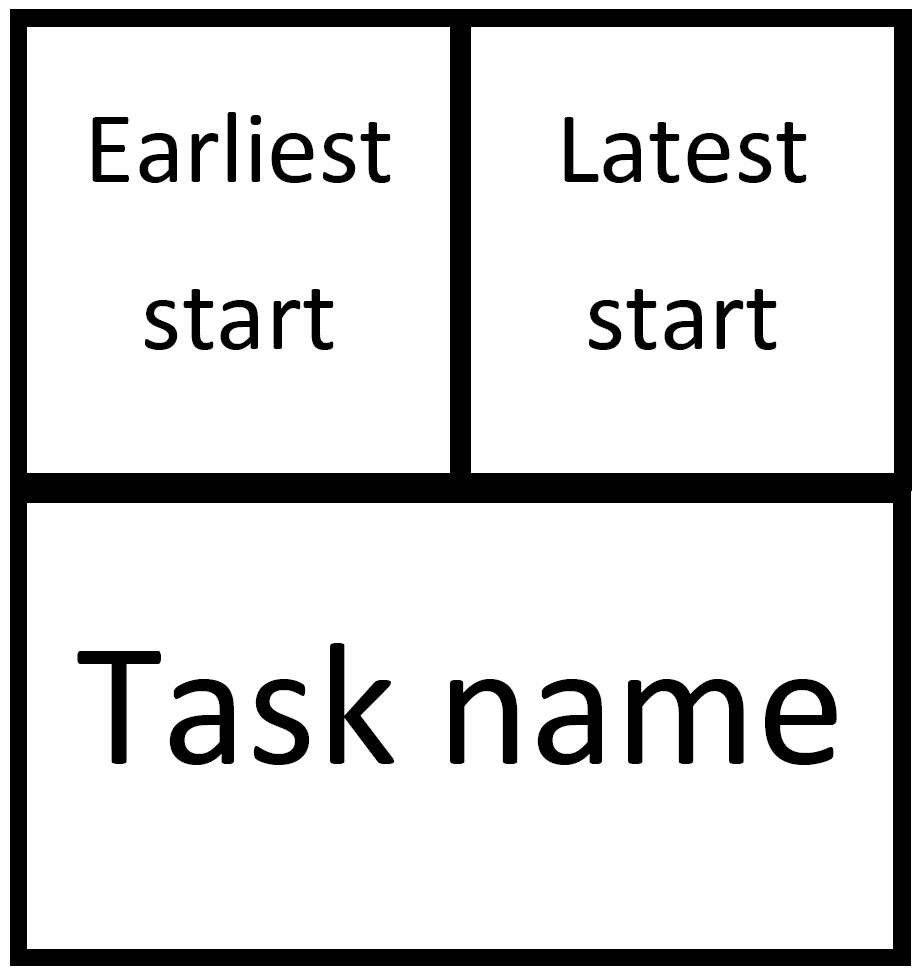
Task: A task is represented by a frame and is identified by its name. The earliest start and latest start corresponding to the task are listed in the top of the frame.
