Mindfulness and Cognitive Biases in Project Management
Before introducing the concept of mindfulness and cognitive biases in relation to project management, a short introduction to complexity and the thinking behind ‘engineering systems’ are necessary, as to explain its relevance and usefulness.
Contents |
Complexity
Even among scientists, there is no unique definition of Complexity (Johnson, 2009). Instead, real-world systems of what scientist believe to be complex, have been used to define complexity in a variety of different ways, according to the respective scientific fields. Here, a system-oriented perspective on complexity is adopted in accordance to the definition in Oehmen et al. (2015), which list the properties of complexity to be:
- Containing multiple parts;
- Possessing a number of connections between the parts;
- Exhibiting dynamic interactions between the parts; and,
- The behaviour produced as a result of those interactions cannot be explained as the simple sum of the parts (emergent behaviour)
In other words, a system contains a number of parts that can be connected in different ways. The parts can vary in type as well as the connections between them can. The number and types of parts and the number and types of the connections between them, determines the complexity of the system. Furthermore, incorporating a dynamic understanding of systems, both the parts and their connections changes over time. The social intricacy of human behaviour are one of the larger reasons for this change. We do not always behave rationally and predictably, as will be further examined below, which increases the complexity of every system where humans are involved.
Engineering systems
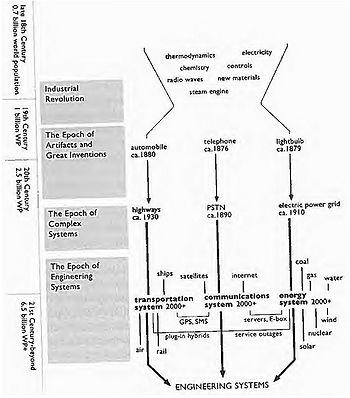
The view that our modern lives are governed by engineering systems, articulated by Weck, Roos, and Magee (2011), are adopted to explain why the complexity of the world only goes one way, upwards. In short, they distinguish between three levels of systems; artifact, complex, and engineering. At artifact level we have inventions such as, cars, phones, the light bulb, etc. In itself, they do not offer any real benefits to our lives. To utilize their potential, and to exploit their respective benefits, the right infrastructure has to be present. Following the above example, the needed infrastructure consists of; roads, public switched telephone network (PSTN), and the electrical power grid. This level of interconnectedness are defined as the complex system level. Following the development of the earlier separated transportation, communication, and the energy systems, one sees that everything is getting increasingly interconnected. This is the engineering systems level. See Figure 1 for a visual representation of the above example.
One of the characteristics of our modern society and the engineering systems governing it, is that technology and humans cannot any longer be separated. Engineering systems is per definition socio-technical systems, which as described in the section above, only adds to the complexity. “Without the right tools to analyse and understand them, complex systems become complicated: They confuse us, and we cannot control what happens or understand why” (Oehmen et al., 2015, p. 5). Mindfulness is one of those tools that can be adopted to project management to help decomplicate the complexity.
Mindfulness
The meaning of the word mindfulness is defined as: The quality or state of being conscious or aware of something (http://www.oxforddictionaries.com). Following definition is elaborating further: “a rich awareness of discriminatory detail. By that we mean that when people act, they are aware of context, of ways in which details differ (in other words, they discriminate among details), and of deviations from their expectations” (Weick & Sutcliffe, 2001, p. 32). To translate this into a useful model, Weick & Sutcliffe (2001) developed five principles of mindfulness, that could be used to increase the reliability of organizations. In other words, to enhance both the chance that an organization can prevent possibly disastrous unexpected events, as well as making a rapid recovery if they do happen. These principles are therefore well suited to deal with the intrinsic uncertainty of human behaviour and the complexity it brings to organizations. Oehmen et al. (2015) have adapted the five principles to the field of project management, seen in Table 1.
Combining Social Network Theory with stakeholder analysis
Application of nodes
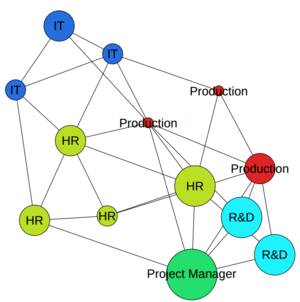
By applying SNT, stakeholders can be given several different attributes, either assigned by themselves or by other stakeholders. These different values (based on a scale) can be illustrated through e.g. the size of the nodes, or by colour, which potentially can help detecting risks or opportunities that otherwise would not have been realised. A list of different attributes can be seen below [1]:
- Themselves: Age, knowledge of the project, seniority, Attitude towards the project, interest, influence, power, involvement of the project, who they are communicating with etc..
- Assigned by other stakeholders: Attitude towards the project, interest, influence, power etc..
In figure 2, an example has been created for illustrating how a network could look like, where the node size represent the “Attitude towards the project” (the larger the node, the more positive a stakeholder is towards the project). From figure 2 it could be argued that the project manager (PM) has not spend enough time promoting the project for the IT- and Production department, due to the fact that their attitude is quite low compared to the stakeholders closer to the PM. If these stakeholders were crucial for the project, an obvious solution would be for the PM to reach out to the departments, open-minded, and investigating the reason for the low attitude. Another argument why it is relevant to reach out is because one of the IT employees actually has a high positive attitude, but he is more or less only interconnected with his own department. Taking into a time/ risk perspective he could potentially over time change his opinion.
Several attributes would also make sense to illustrate through the interconnections (edges) between stakeholders, but this article will only focus on applying colour and changing sizes of the nodes for illustrating important discoveries throughout the article.
Betweenness Centrality
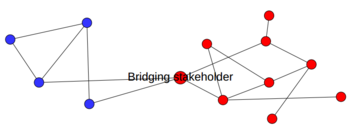
The type of network illustrated in figure 3 can be characterised as a bridging network [2]. Being aware of this kind of network can be very beneficial for a PM during projects. Stakeholders identified in the center of bridging networks are also called gatekeepers/brokers [1], which can help the PM in numerous ways. Using gatekeepers can help the PM controlling the type of information and the flow of what should be directed where. This type of stakeholder will usually have strong ties with his interconnected stakeholders, which is very common, due to the fact that as more interactions a stakeholder have, the weaker they will become[3]. Therefore, a good starting point for a project would be for the PM to get the gatekeepers support so they can act as ambassadors throughout their network, when communicating the project.
This type of network is a good example of how stakeholders with e.g. low formal power actually still can have a strong influence through informal power. Without this stakeholder, the whole network would otherwise decay and consequences of this could be damaging to the success of the project. An example of this could be an employee that has moved to another department, but still has a lot of social interrelations with his previous department.
The algorithm calculating the betweenness centrality in nodes, are based on counting how many times a stakeholder is the path between two stakeholders that are not directly interconnected (acting as the bridge) [1] [4].
Degree Centrality
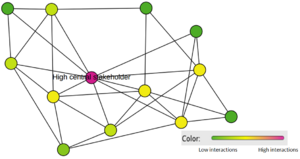
From figure 4, a network has been created, which illustrates what can be defined as a cohesive network [2]. This type of network emerges, when interactions between many stakeholders exist and especially one or few are highly interlinked. These stakeholders can also be stated to have a high degree of centrality. From figure 4 a visual illustration shows that the algorithm can colour the individual stakeholders from the way they are interconnected, where the “pink” stakeholder will be the person with highest degree of centrality.
Overall can this type of network be very important to identify because, usually there will be a lot of trust in this kind of network, and the central stakeholders can help to bring a network together towards a project, due to their internal relations. This can again be related back to some degree of informal power. It can therefore be a good suggestion for a PM to approach this stakeholder and create an alliance instead of approaching every single stakeholder himself. As a project progresses these interrelations will probably change and it is therefore important that the network is updated and time is spend analysing possible trends of interrelations. Identifying these highly interconnected stakeholders can also, from a cost- or time perspective, be very efficient because the PM can use the highly interconnected stakeholders for disseminate information throughout the network [5].
This type of algorithm is quite simple structured, due the fact that it works by counting the edges for every single node, and from that it is possible to either colour grade, or alter the size of, the nodes [1] [4].
Eigenvector Centrality
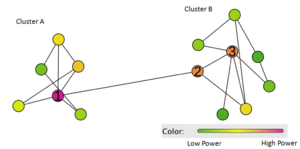
Taking into account that networks can actually be quite complex, and not as simple as figure 3 and figure 4, more advanced methods can be applied. One example is the eigenvector centrality algorithm [4]. This algorithm bases the level of power of not only how interconnected a stakeholder is, but also how interconnected the stakeholder is with other stakeholders with a high interconnection density. This has been illustrated in figure 5.
Looking into figure 5, three stakeholders are of particularly interest; stakeholder one (S1) in cluster A, could be identified as the manager for the department and stakeholder two (S2) in cluster B could be the other manager. These two stakeholders are both rated as high powered, due to the fact that they are well interconnected within their own respective networks, but are also the connection between the two clusters. This could therefore illustrate a more formal power scenario. The third stakeholder (S3) is rated as an equal high powered stakeholder as S2, where S3 could be a respected employee, other trust and listen to (informal power). This will be important for a PM to look into because, S2 and S3 could be the essential combination for creating the necessary support so the whole cluster/department would commit to the project. When analysing this kind of networks, it is of course still important to take into account for the designed network, such as organisational diagrams, which directly can illustrate the formal power.
Conclusion
This article has been based on the assumption that stakeholders themselves will not only be important for the success of a project, but also understanding the way they are interacting will be crucial. By implementing a more in-depth quantitative SNA into the current qualitative stakeholder analysis will provide a stronger framework for identifying crucial stakeholders. This will help to get an overview for how to focus attention and for how to categories the most relevant stakeholders. This will help for identifying not only the formal power structure within a project, but also how informal power can influence the success of the project.
Applying the presented algorithms will give an overview of the more active and communicative stakeholders in the network, which will be beneficial to consider, when developing e.g. communication plans. This is done by analysing the centrality in the network of stakeholders, which will help narrowing down, which will be crucial for approaching and convincing for committing to a project. One should not neglect the importance of already established networks, such organisational structures, which still provides important information regarding e.g. power structures that can be useful for taking into consideration.
It is very important to emphasise and recognise that SNA does not replace the traditional stakeholder analysis, but should be applied as a combination of both. This especially concerns the data gathering process. It will be primarily through the qualitatively data collection, e.g. interviews, where the external environment can be explored and gone into depth, where internal perspectives are primarily explored through quantitative data collection. Possible downsides, for combing these methods, are that it can be a more costly and time consuming data collecting process, compared to e.g. large focus groups[6].
References
- ↑ 1.0 1.1 1.2 1.3 Lienert Judit, Schnetzer Florian and Ingold Karin, (2013) Stakeholder analysis combined with social network analysis provides fine-grained insights into water infrastructure planning processes, Extension Farming Systems Journal, Vol.125, PP.134-148
- ↑ Cite error: Invalid
<ref>tag; no text was provided for refs namedchange - ↑ Cite error: Invalid
<ref>tag; no text was provided for refs namedKlaus - ↑ 4.0 4.1 4.2 Wasserman Stanley, Faust Katherine (1994). Social Network Analysis: Methods and Applications, Cambridge University Press. ISBN 9780521387071.
- ↑ Freeman Linton, (1978), Centrality in Social Networks Conceptual Clarification, Social Networks, Vol.1, PP.215-239
- ↑ Cite error: Invalid
<ref>tag; no text was provided for refs namedReed
