Novozymes - CAPEX Portfolio Management
![]()
Collection of tools
The following section will describe the project- and portfolio management related tools, which will be the base literature study for Group Cake further analysis.
1. Portfolio communication plan
Effective communication is a critical process in all aspects of organizational management. Some even consider it as the essence of an organization, considering that it ensures everything is tied together, and everyone is on the same page. Portfolio management is no different, and organizational communication plays a vital role in project portfolio management. Considering the many aspects that go into a portfolio, there is a need for effective portfolio communication management between stakeholders, customers, portfolio managers, and everyone involved in portfolio management. This is because of the lack of portfolio communication management can spell the difference between a successful and failure project. For successful portfolio management, a portfolio communication management plan must be developed. It must be done in such a way that it is closely aligned with organizational strategy, portfolio governance management, portfolio risk management, and portfolio performance management.

A process to follow in order to establish a beneficial communication plan with a well-defined content and time frame for the communication. Additional reference can be seen in the book “The unofficial PM” on page122.
2. The project status report
The project status report can be used to continuously communicate the status of the project work to a project’s key stakeholders. The reports should be aligned with a project’s communication plan and should not belong and extensive reports, but should instead be a to the point update that informs about the project’s accomplishments, pending and potential problems and upcoming plans. The main element of the report is a traffic light signal indicating the current health of the project, which functions as either a confirmation, warning or ask for help to the project’s key stakeholders.
3. Key stakeholder interview tool
The tool for key stakeholder interview can be used in the preliminary phase of the project where the project purpose, scope and desired results are to be determined. The tool consists of a brief presentation of seven project elements (the project’s purpose, description, desired results, exclusions, communication needs, acceptance criteria and constraints) that are to be discussed and aligned with all key stakeholders. By using the tool, the project team can ensure that all key stakeholders have been presented the same information and have had the opportunity to express their thoughts and concerns about the project.

4. Project scope statement tool
The project scope statement follows right after the conclusions of all key stakeholder interviews as the project team here is to combine all stakeholder inputs into a final project scope statement. The project scope statement, therefore, includes clear alignments of the seven project elements presented and discussed by the key stakeholder interview tool.
5. Portfolio roadmap
The portfolio roadmap is a tool to create a high-level overview of the strategy for the organization, normally illustrated graphically. The roadmap enables managers to visualize how products will perform on an individual basis, but also how products are related. It is important to keep the roadmap updated. This should be done every time there is an optimization for the portfolio or when greater changes for the portfolio is conducted.
6. Stakeholder interest table
A Stakeholder Interest Table consists of Stakeholders Groups, which is described out from different Stakeholders based on their roles, level of interest and Stakeholder expectations. In order to meet all communication requirements, it is needed to identify and analyze all possible stakeholders for the portfolio.
7. The risk management plan
An overall plan used by the project manager, to identify risk grouped into categories. Each risk’s probability and impact is rated and the risks with the highest combinations are explained further including actions on how to mitigate the risk and how to act if the risk occurs. The risk management plan makes sure the project manager addresses the potential risks and contains strategies to avoid the common problem to arise. This plan should be updated continuously, to make sure it reflects the current state of the project.
8. Work Breakdown Structure
The Work Breakdown Structure (WBS) is a management tool that is utilized in projects to structurize and split up deliverables in a hierarchy. The tool is widely used as a backbone of a project if it’s done correctly, as projects on large-scale have a high number of deliverables and the purpose of the project can get interpreted differently. WBS provides clearance and guidance of the project scope, as it provides a great visual overview. WBS is an important tool, as it mitigates the risk of missing deliverables and certain tasks. Additionally, it can divide complex deliverables into smaller, more manageable tasks. In order for the tool to be utilized to its full potential, the different teams within the project need to share their knowledge within their field of expertise, in order to create a complete WBS.
The tool enables the group to understand the different aspects of the Portfolio Management Tool (PFMT) utilized at Novozymes, for reviewing and analyzing potential- and already ongoing projects. WBS makes it possible to analyze the processes of the Portfolio Manager and visualize the tasks within the PFMT.
An example of how WBS can be used is as seen below

Starting from level 1, where the concept of a Garden Party is initiated. Such a party is a combination of different processes, seen in level 2. Each of these processes is then detailed into smaller deliverables, which are more manageable which will ensure a great party.
Reflections on WBS
Pros: The tool provides a detailed overview of the different deliverables in a project. These can be further detailed, by adding cost, time and resource allocation to fully understand each task.
Cons: If the WBS is not constructed properly, the scope of the project is not defined correctly and deliverables might be missed.
9. Fault tree analysis
At Bell Telephone Laboratories in 1962 the Fault tree analysis (FTA) was introduced as a top-down logic diagram which “displays the interrelationships between a potentially critical event in a system and the cause of this event”. Depending on the scope of the analysis the FTA may be quantitative, qualitative, or both. The FTA is a widely used method where one of the main objectives is to “determine the various combinations of hardware and software failures and human errors that could cause undesired events at the system level”. The FTA is a binary analysis where all event, from the undesired event/hazard/fault condition to the lower-level events, are assumed to either does not occur or do occur henze binary events. This means that no intermediate state is allowed in a fault tree (e.g. the state of 60% good). The Fault Tree diagrams is a deterministic model and single-event oriented which mean that a separate fault tree must, therefore, be constructed for each potential top-level event (undesired event/hazard/fault condition) in the system.
In order to do a comprehensive Fault Tree analysis, the following steps should be followed:
- Identify the undesired event/hazard/fault condition: the primary event/fault being analyzed
- Obtain an understanding of the system being analyzed: determine the possible reasons for the undesired event/hazard/fault condition to occur by using professional judgement and technical information.
- Continue to move one step back until the lowest level has been identified.
- Construct and review the final fault tree. It’s important to know that the chain can only be terminated in a basic fault: human, software or hardware.
- Evaluate the created fault tree: If possible, the probability of occurrence for each of the lowest level elements should be evaluated which enables the calculation of the statistical probabilities from the bottom up.
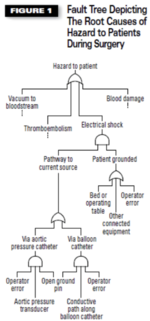
This tool can help the group investigate and understand the underlying reasons for errors in the current system of the company’s current practices and ways of e.g. estimating running project budgets at Novozymes.
10. Iron triangle
Project managers work within three constraints: cost, scope and time also known as the three constraints. In order to model these constraints that project managers work within on every project, they oversee the Iron triangle also known as flexibility matrix or project management triangle. The iron triangle was created in the mid-1980s by Dr Martin Barnes and demonstrates that the constraints are interrelated which means that if focussing or fixing one constraint of the triangle impacts the two other points. Since the creation of the Iron triangle, multiple versions have been proposed where some are more common variations than others.
The iron triangle is as the name indicates shaped like a triangle with time (or schedule) is placed at the top of the triangle, scope in the left and cost (or budget) at the right. One of these constraints could be the most important to the end-user depending on the project and/or who is involved.
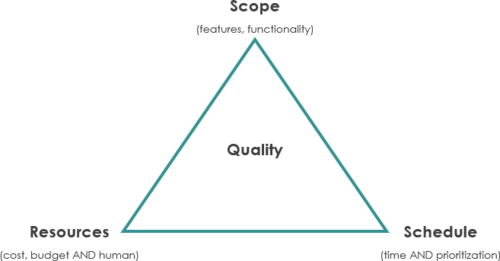
The iron triangle can help the group maintain constant awareness of changes in the project scope which brings with it the opportunity of discussing the trade-offs within the different constraints and thereby make adjustments to the changes/analysis and thereby keep the project on track.
References
The following section will specify the sources to every listed tool above.
- 1. Portfolio communication plan : https://www.project-management.pm/portfolio-management/portfolio-communication-management/
- 2. The project status report : Blakemore, S., Kogon, K. and Wood, J. (2015). Project Management for the Unofficial Project Manager. BenBella Books, Inc. ISBN: 978-1-941631-10-2. PP 167-169.
- 3. Key stakeholder interview tool : Blakemore, S., Kogon, K. and Wood, J. (2015). Project Management for the Unofficial Project Manager. BenBella Books, Inc. ISBN: 978-1-941631-10-2. PP 53-56.
- 4. Project scope statement tool : Blakemore, S., Kogon, K. and Wood, J. (2015). Project Management for the Unofficial Project Manager. BenBella Books, Inc. ISBN: 978-1-941631-10-2. PP 67+68.
- 5. Portfolio roadmap : PMI, (2018). The standard for portfolio management 4th Edition. PMI. ISBN: 978-1-628253-97-9 p. 35
- 6. Stakeholder interest table : PMI, (2018). The standard for portfolio management 4th Edition. PMI. ISBN: 978-1-628253-97-9 p. 65+66
- 7. The risk management plan : Blakemore, S., Kogon, K. and Wood, J. (2015). Project Management for the Unofficial Project Manager. BenBella Books, Inc. ISBN: 978-1-941631-10-2. PP ??-??
- 8. Work Breakdown Structure : http://wiki.doing-projects.org/index.php/The_work_breakdown_structure_in_project_management, The standard for portfolio management 4th Edition. PMI. ISBN: 978-1-628253-97-9 Chapter 8.
- 9. Fault three analysis: Reliability of Safety-Critical Systems: Theory and Applications, 2014, by Rausand, Marvin. From Department of production and quality engineering & http://asq.org/quality-progress/2002/03/problem-solving/what-is-a-fault-tree-analysis.html