Optimizing Contracting Strategies
In order to manage successfully a project, certain perspectives need to be covered.
- Purpose
- People
- Complexity
- Uncertainty
This article briefly explains the tools that can be used to analyze each perspective.
Contents |
Purpose
Vision Statement
SMART goals
Project Charter
Value Proposition Canvas

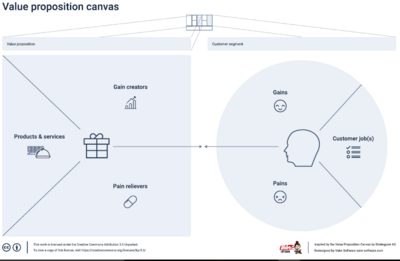
The value proposition canvas is a tool that helps to ensure that the solution considers the needs, values, and pains of the customers. This canvas analyses:
- Customer segment:
Customer job(s): The customer job(s) assess what the customer wants to do, which actions or tasks does the customer or user want to perform.
Pains: This can be a result of competitors lacking the necessary capabilities to offer a proper product or service. It can also be a result of users not having access to any products or services to fulfill their customer job. The project manager must acknowledge these customer pains, in order to identify the benefits project outcomes need to incorporate.
Gains: Unlike pains, gains are not factors that are clear for the user. These are factors that the user is not necessarily expecting of a product or service but are extra benefits supplied.
- Value proposition:
Products & Services: Outlines the products and services the project outcome is built around.
Pain relievers: ways of removing the customer/user’s pains.
Gain Creators: deliverables creating the extra gains for the customer/user.
For further information refer to the following DTU wiki link.
Project governance framework
Business Case
Key Performance Indicators (KPI)
This tool represents a quantitative measurement of a company's efficiency. It evaluates their success at achieving key business objectives and reaching specific targets. KPI can be applied of different level, depending on the process they focus on. These assessments frequently help identify potential improvements, which then often lead to initiatives to improve performance.
These indicators can be either quantitative or qualitative:
- They are considered quantitative when numerical and objective facts are gathered and measured against a standard.
- They are qualitative when values that are presented as numbers or text representing opinions or personal feelings are compared to equivalent measurements.
People
Value Proposition Canvas

The value proposition canvas is a tool that helps to ensure that the solution considers the needs, values, and pains of the customers. This canvas analyses:
- Customer segment:
Customer job(s): The customer job(s) assess what the customer wants to do, which actions or tasks does the customer or user want to perform.
Pains: This can be a result of competitors lacking the necessary capabilities to offer a proper product or service. It can also be a result of users not having access to any products or services to fulfill their customer job. The project manager must acknowledge these customer pains, in order to identify the benefits project outcomes need to incorporate.
Gains: Unlike pains, gains are not factors that are clear for the user. These are factors that the user is not necessarily expecting of a product or service but are extra benefits supplied.
- Value proposition:
Products & Services: Outlines the products and services the project outcome is built around.
Pain relievers: ways of removing the customer/user’s pains.
Gain Creators: deliverables creating the extra gains for the customer/user.
For further information refer to the following DTU wiki link.
Maslow hierarchy of needs
Maslow proposes five levels of needs ordered in a hierarchy of needs. Once the requirements of a level are met on an on-going basis, their needs move to the next level up.
This theory can be extrapolated to the project management environment, to come to the conclusion that:
- Until the basic needs are met, an individual will not be looking for higher-order needs.
- Motivation can be provided through an individual pursuing as yet unmet needs.
For further information refer to the following DTU wiki link.
Complexity
Complexity happens when too many parts come together and it becomes difficult to structure and organize the activities, portfolio and cost flows. In order to manage the situation, the first step to take would be trying to break down the main tasks. Once smaller tasks are gathered, it will be easier to focus on their complexity individually. It is convenient to break down each task as much as possible so even if this will create many starts treating them as smaller individual tasks.
The following tools are used to break down the situation.
Contracting and procurement
Contracting refers to the process of creating an agreement between multiple parties that is mutually binding. The arrangement is aimed to provide the so-called buyer with a product or service that the seller offers.
Procurement encompasses all the activities through which products or services are acquired from external members to the employee base. Amongst the responsibilities of Project Procurement Management (PPM), is the process to identify which of various alternatives fits best a purpose and how to complete its purchase or hiring most efficiently. The latter is where a contract is put together, making contracting one of the most important components of PPM.
Gant Chart in Project Management
A Gantt Chart is a timeline management tool to illustrate how a project will be running. Thanks to the tool it is possible to view individual tasks, their durations and the sequencing of these tasks. Also, it is very useful as it illustrates the overall view of the timeline of the project and the expected completion dates of each phase.
One of the several benefits of using Gant Charts in Project Management is the possibility to run the project with greater efficiency with improved either cost and time outcomes Basically, a Gantt chart provides a graphical illustration of a schedule that helps to plan, coordinate, and track specific tasks in a project.
Thus, in order to be able to build a valid model these are the steps that must be taken:
Step 1: Identify Essential Tasks
Step 2: Identify Task Relationships: These dependent activities are called "sequential" or "linear" tasks. Other tasks will be "parallel”.
Step 3: Input Activities Into Software Or a Template: there are many programs that help us build Gant chart like Microsoft Project, for instance.
Step 4: Chart Progress: the chart needs to be updated in order to reflect changes as soon as they occur
Benefit Mapping
Benefit mapping can be seen as one of the key elements, that support organisations to identify benefits and criteria for organisational aims and objectives in benefits realisation management.
The tool is used to receive a visual presentation to evaluate a specific business case by displaying efforts and gains. The visual presentation displays the complete life-cycle. Therefore the decision maker can use the tool to evaluate why a potential project or program should be implement or not.
Theses structured methodology is using the collection of knowledge from a number of different people. In a so called benefit workshops benefits can be gathered and discussed. Thereby, a various number of benefits are collected which can be classified e.g. in tangible or intangible.
The investigation and involvement of stakeholders that are effected by the benefit map is one important part for a successful benefit map. Therefore, stakeholder should be considered from the beginning and involved in all process steps.[2]
Uncertainty
Recovery Project Management
Project failure can happen to any project. Statistics report that only 52% of completed projects meet their proposed functionality.
There is a five steps approach to recovering projects that are failing. This plan works to provide structure and results for the Recovery Project Manager (individual person from outside the project and who then is not the Project Manager) and his or her team. The process begins by focusing on determining the current real status of the project and the changes that need to be made in people, the product or service specifications of the project, and project management processes in order to improve performance. The most critical steps to be taken include:
Defining the Charter
- Define the mission with the sponsor
- Understand the project history and sensitivities
- Establish initial project team contact
- Determine the assessment approach
- Complete the charter and obtain approval
Developing the Assessment Plan that is:
- Realistic
- Allows an assessment in short time
- Ensures accurate findings
- Minimizes team distractions
Conducting the Assessment on three main areas:
- Determining the true current status of the project
- Identifying the major threats, opportunities and problems for the project moving forward
- Establishing an extended team for the recovery effort
Developing the Recovery Plan
- Focus on building everyone's morale
- Deal directly with personnel problems
- Resolve serious leadership problems
- Add people to the project carefully
Conducting the Recovery
- In recovery, the “end state” needs to be in mind to start.
- The team monitors the execution of each milestone, it will conduct variance analysis at the end of each week.
This is an example or five key steps to go through project recovery but there are many other ways to manage failure in Projects. In the end, Project recovery is the effort and activities related to addressing troubled projects. In other words, the activities that leads to recognise that the project is troubled, after which brings to a decision point on whether or not to save that project.
The Triple Constraint in Project Management
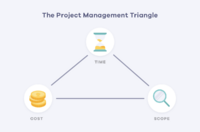
The Triple Constraint is often also known as The Project Management Triangle or the Iron Triangle. It represents the boundaries of scope, time, and cost that each project is to operate within, and how a variation in any of the three will forcefully have an effect upon the other two.
Scope, time and cost can also be seen not just as boundaries, but as priorities. It is the project management team's responsibility to assure overall contribution towards meeting the client's requirements, whether their focus is on scope, budget or deadline. This tool helps visualize the importance of each aspect of a project.
References
- ↑ Cite error: Invalid
<ref>tag; no text was provided for refs namedStrategy - ↑ 2.0 2.1 Hayes, John The Theory and practice of change management, Palgrave Macmillan, 4th edition, 2014.
- ↑ Social network analysis,Wikipedia https://en.wikipedia.org/wiki/Stakeholder_analysis

