Overcoming small-big projects (Gantt)
Contents |
Abstract
Overcoming small to big projects, a simple way to managing a project is with the tool, Gantt also called Bart Chart, which helps a project manager to execute a single project or multiple projects at one place. It helps to overcome and breakdown a variety of tasks with different due dates and large project information. A Gantt Chart consists of an activity list or a work breakdown structure (WBS) given against important dates, which shows durations of how long a project will be held. There are five steps in order to create or prepare for a Gantt Chart and this article will take you through more about what a Gantt Chart is used for, who and how many can be involved, how to create a Gantt and benefits and complications about using this tool.
What is a Gantt
A simple way to managing a project whether it is complex or not, Gantt Chart also called Bar Chart, has great benefits for many different aspects when executing a project such as having an overview, communication with team or stakeholders, delegating tasks, planning, list of resources, previous and new incoming project information, deliveries, milestones, monitoring etc. [1]
A Gantt Chart contains the list of tasks or activities plotted against the duration either in dates or weeks and the progress of each tasks. It can also indicate who is assigned to which tasks. If we think more of structuring these tasks or activities it can also be divided into different phases of a project, but depends on what kind of field a project manager is working in.
It can either be scheduled as a simple summary of project information which creates a quick overview or towards a more detailed schedule. If dealing with multiple projects the project manager is able to have projects in one place for updating and monitoring the multiple projects at once. Using the tool correctly or regularly the project manager can have projects executed successfully
Create Gantt Chart
According the PMBOOK Guide [1], Gantt is a tool to do part of the process of ‘project schedule management’ which is, if you reversed the words, to ‘manage a scheduled project’ (Gantt). So, in order manage your scheduled project(s) or use a Gantt Chart, five overall steps have been provided:
Five Steps: [1]
1. Define Activities
2. Sequence Activities
3. Estimate Activity Durations
4. Develop Schedule
5. Control Schedule
(1) First you create of Activity List or a Work Breakdown Structure (WBS), which is what you as a project manager probably already have defined when creating an overview of received information from your project(s). Also called the project scope This list could also include information regarding deadlines or constraints depending on the project.
(2) If all you have is a list or an overview of activities that is need to be done within the project, with no particular order, the second step gives you the opportunity to do so by sequencing the activities.
(3) Given from possible deadlines you received, in this third step you estimate when these activities or tasks needs to be completed or when they are able to be completed, which could be on specific dates, within weeks or years.
(4) Now, you can call this fourth step, the last step in order to 'develop' the schedule (Gantt). Here you simply plot in the gathered project information from previous three steps. Using a MS Excel sheet Starting from left to the right on the Gantt Chart, the activity list is placed vertically, and duration are placed horizontally along each activity representing as bar’s, if wanted, in different colours. This step makes you as a project manager to execute, monitor and control the project(s).
(5) The fifth step is quite an important one to use the Gantt Chart properly. The word 'control the schedule’ may seem a bit harsh of a word to use, but this is where you are able to monitor the project, whether you are on the right or wrong track on the project(s) or if any new project information has occurred, gives you the opportunity to update schedule (Gantt) along the way. And by that, not only does it make you as a project manager able to see previous and recent information, but the Gantt Chart also makes your stakeholders and employees/co-workers updated on the project. Creating an easy graphically way of communicating between all parts in the project(s).
Simple way (MS Excel)
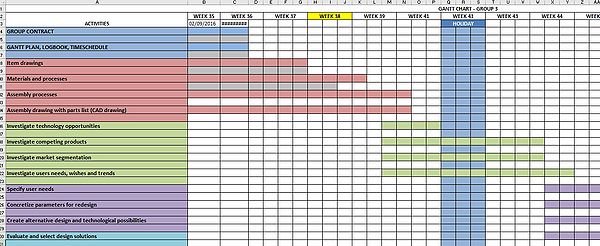
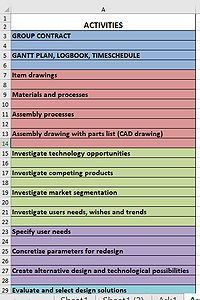
(1) Starting with a clean MS Excel sheet, you list all the activities on the left side vertically. Now you may not have colours in the beginning, but this is easily added once you know how the different tasks are related. This is example is based on a previous product development project, so this activity list is conducted by the phases of the product development (stage gate) and additional information regarding the project. But this give you somewhat idea of which tasks to include. In this case colours were used as headlines, but an extra tab with headlines can easily be added. Which is useful for example when working with a multidisciplinary team
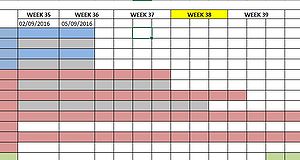
(2) The columns horizontally (x-axis) is where the dates are added (depends on your project). In this case weeks and specific dates were added in regard to the deadlines within the project. See figure 3.
(3) According the activity and deadlines, the bars that is representing the required duration of the tasks. Underneath the first coloured bar of the tasks, the process of the tasks is shown, in this case the colour grey. See figure 4.
(4) This is the bars that will be updated the most during the whole project scope. Depending on how the team and project manager works, the ‘grey’ bar will be updated for example each day, end of week or at every ‘update meeting’ with the team where it is noted by each member how it is going given task. See figure 4.
(5) The yellow box in the dates is also a ‘update’ from the project manager side. This is to keep on track which is the current date/week. See figure 3.
Critical Paths
Once the project information has been embedded the Gantt can be analysed and identifying ‘critical paths’ for the project.
,,‘Remember that the critical path is the shortest possible path through the project. If any of the tasks on the critical path becomes longer, it will increase the amount of time it takes to get through the project.”” [4]
When analysing the Gantt and you find these critically paths, and these path will become longer, It will increase the amount of time throughout the project. However this happens, assigning more people to one of the tasks or find a way to reschedule, it can be possible to pull the expected date in again. This however can also become more costly if assigning another employee to the task. This also helps the project manager to decide what needs more attention than other tasks.
Existing template (MS Excel)
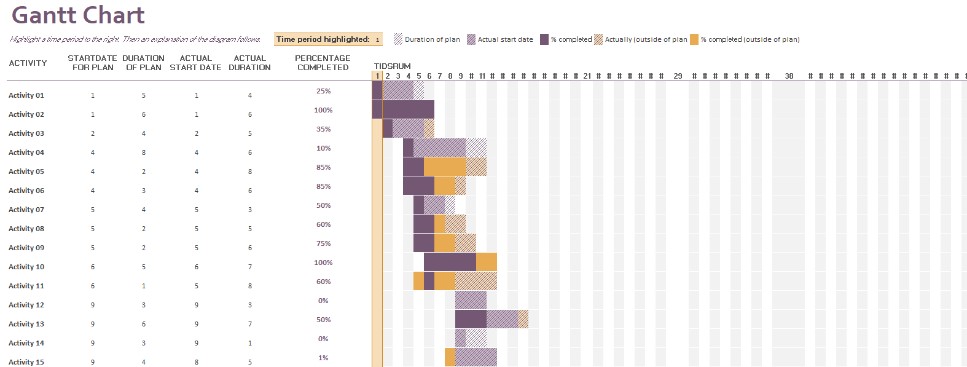
(6) For an existing template, MS Excel has on today’s notes, already provided a template to utilize. This template has more ‘list’s’ next the activities. This template is also fairly easy, because you get to plot simple information regarding the start date of plan, duration of plan, actual start date and duration in days. Which is also useful, is you can get into more specifics with the percentages of the process for each task.
Detailed way (Gantt Software, MatchWare)
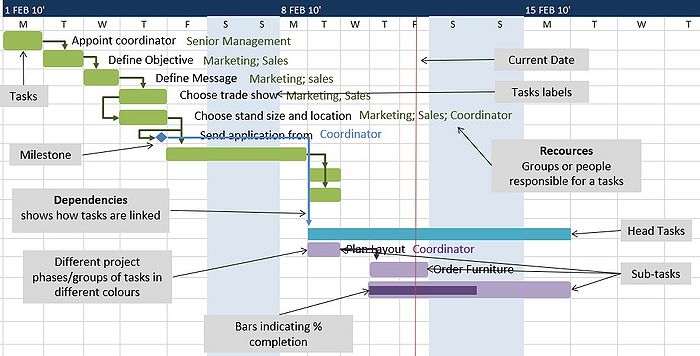
Now going from using simple MS Excel to the official Gantt Chart tool software. The difference from the ‘simple Gantt Chart’ is that more information or details about a project can be provided in the schedule (Gantt) and the fact it looks ‘professional’, which preferably for bigger ‘complexed’ engineering projects. More horizontally headlines such as predecessors and priority. More constrains or dependencies can be added and who is assigned to which tasks (resources) and so forth. [2] [3]
In figure 6, you will see what is in cooperated in this detailed Gantt Chart. For further knowledge on how to utilize the software, you can see a video tutorial by following the reference link [1].
Oberservations
Using a Gantt Chart has great benefits for many reasons. It creates overview over one or many projects in one place. It helps communicating visually for every person involved in the project; stakeholders, co-workers, possible other managers or bosses, very easily. When used before it also helps you as an manager to prepare even better for further projects. Gantt is also useful to look back at what you have done in previous settings. If the project(s) is not executed for some reason, you can also look back at what has been done. If of course the Gantt has been updating along the way. [5] [4] Which can be con for using the Gantt Chart. If the schedule has not been updated regularly, it is very easy to loose focus and overview on he project(s). A problem that can occur when using a Gantt is if stakeholders or co-workers also have 100 procent access to editing the Gantt Chart, it is possible that data can be mistakenly lost. So a reminder for a project manager is to for example clarify whom can update what on the schedule. Although the Gantt might be easy to communicate easily, because it mostly follows a 'line' or 'sequence of the project when reading. But the information embedded in the Gantt can be hard to read, especially if the Gantt has been delivered very detailed. Depending who you are dealing with in the project, this might be something to also consider making the Gantt. [5] [4]
With the Gantt Chart ensures to create overview from simple to complex projects and that nothing has been excluded overall from the project(s), by using WBS, activity list and Gantt in general. The Gantt enables you as a project manager to predict certain times devotions or drawbacks that might occur during the time. [5] [4]
The benefits of gantt is to take a comprehensive project, plan it and executing. From experience [5] all work felt planned and controlled which was a ‘nice’ feeling for employees and other stakeholders. It shown promises, that solutions, meaning task as solution to doing the project was a procedure and constructed through existing commitments [5]. It also a day-to-day plan so again every stakeholders were knew about the project and becamse highly effective to execute sales for their company [5]. The process of work also gives a flowing process with coordinating tasks, given from a factory; orders would flow through. [5].
However even though the gantt seems all great, with a flowing process, overview, easy communication, the gantt is not a solution technique per say, it more of a tool to ‘give ideas’ and understanding in order to solve potential problems within a project, which still makes the tool useful. Al though, MS Excel might be easy to utilize for simple projects, it can be useful for making the Gantt more detailed, which can be very time consuming. Using an existing Gantt tool, might be better for larger projects, since all the different tools are provided within the software.
Bibliography
1. Project Management: A guide to the Project Management Body of Knowledge (PMBOK guide) 6th Edition (2017) | Knowledge on what Gantt is and in which context it is used
2. Project Management: "Managing Successful Projects with PRINCE2" 6th Edition (2017) | Knowledge on where Gantt can be used
3. James M., W., 2003. European Journal of Operational Research; Gantt charts: A centenary appreciation. | Experinces with Gantt Chart, from its start until today
References
[1] YouTube. 2021. How To Build A Gantt Chart - YouTube. [ONLINE] Available at: https://www.youtube.com/watch?v=2IstuLPYrv8&feature=emb_title&ab_channel=MatchwareSoftware. [Accessed 28 February 2021].
[2] Gantt.com. 2021. What is a Gantt Chart? Gantt Chart Software, Information, and History. [ONLINE] Available at: https://www.gantt.com/. [Accessed 28 February 2021].
[3] ProjectManager.com. 2021. Gantt Chart: The Ultimate Guide (with Examples) - ProjectManager.com. [ONLINE] Available at: https://www.projectmanager.com/gantt-chart. [Accessed 28 February 2021].
[4] Cromar, S., 2013. From Techie to Boss pp 231-234; PERT and Gantt Analysis
[5] James M., W., 2003. European Journal of Operational Research; Gantt charts: A centenary appreciation.
