Performance Reporting
Performance reporting is the process of tracking, reviewing, and reporting the progress to meet the performance objectives defined in the project management plan. When a project exceed a certain scale is necessary to establish some form of formal control. By controlling the status of a project, a manager can keep people accountable for process execution and prevent minor problems to scale up. The main outcome of a performance reporting system is providing information about the progression of a project. These information should be available in a time range that allows the project manager to eventually take effective corrective actions [1]. Performance reporting needs to provide information at an appropriate level for each audience as it is delivered the project manager and to stakeholders involved in the project. Consequently, the report metrics has to represent and estimate accurately the intended performance. Typically, key measures in progress reporting assume time or financial value. Managers has to identify in the organization different professional in charge of the report maintenance. These are appointed of gathering data, implementing the report and of distribute it to all the involved stakeholders. While the project is in execution, the actual data are compared with the estimated data, defined by the baseline. This pages focus on different quantitative tools and indexes to perform this comparison. Occurrence of variances can be considered as signal of ineffective process execution. In a longer time prospective, the purpose of performance reporting is to prove how different decision making process and practices led to failure or success. This insight should then be used as guideline for improvement by replicating good practices and avoiding mistakes[2].
Contents |
Scope of Performance reporting
The main input for Performance reporting is the project management plan. Many different knowledge areas contribute in writing the plane. These areas also play a role in monitoring the project work. Many documents they issue help to asses the status of the project[3]. The following table illustrates the knowledge areas or function that usually contribute in generating the reports, their role in the reporting process and the document they use to generate the reports:
| Area | Role | Reporting documents |
|---|---|---|
| Scope (or Configuration) Management | The scope of work defines what the project is producing or delivering. Reports will take track of scope variation during the implementation. |
|
| Technical Support | Technical experts keeps track of their results to interpret clients need and addressing it respecting regulation and adopting good practices. |
|
| Time Management | Outlines the sequence and timing of the scope of work through control documents as Progress report |
|
| Procurement Management | The procurement function classifies all the purchased items. These are procured to specification, time schedule and budget |
|
| Resource Management | Resource management is in charge to integrate the resource estimate with time management to produce resource forecast. Used resourced are closely linked to manpower requirements. |
|
| Cost Management | Cost Management allocates budgets and cash-flows to the work packages |
|
| Change Control | Set of documents that tracks and revise the progress of the scope of work. |
|
| Quality Management | State how the company plans to meet the requirements |
|
| Communication Management | The communication functions share information and instruction to the responsible parties. |
|
| Human Resource Management | The HR function sets frameworks for the persons employed in the project. |
|
| Environmental Management | Takes in account all the external issues that may effect the project. |
|
Set Up
Maintenance
Before implementing a monitoring system is important to establish:
- Who should be responsible to gather and elaborate the data. It could be a project team, contractors, cost engineers or data could come from the company's ERP[4]
- When the data will be assembled and communicated and which is going to be the reporting period (day, week, months, quarter...)
Setting a Baseline Plan

The first action to implement progress and performance reporting is setting a baseline. The development of a project baseline is properly a part of planning process. However, since it constitutes the main input for the comparison with actual data, it constitutes the foundation for any reporting activity. The baseline is an written document that represents commitment to the achievement of some cost, schedule or other performance. The reference value are acquired from the work breakdown structure. The WBS provides discrete work packages tied to deliverables and organization unit. Furthermore, each work package defines the work, duration and budget. The project network schedule time-phase all work, resources and budget into a baseline plan. The costs included in the baseline are usually labor, equipment and materials. Also direct overhead costs are associated to different work packages. One of the most common methods to assign costs to the baseline is to divide in percentage the completion of the project. This is possible by identify a relevant measure unit that properly express the progression of the project. Units could be workdays, drawing completed, line or code or others.
Measuring Progress and Performance
Data acquisition (or capture) is the activity of selecting and collecting data that builds up the information in a report. This activity is performed adopting a time frequency that allows to appreciate the variations of the process .For instance sales number could be reported daily while financing cost could be displayed in a monthly report. At the same time the data contained in the report as to be enough recent to allow the project management to take corrective actions on the reported activities. The purpose of the metrics is to provide the management with the current situation overview and estimated future scenarios.
Time and cost Performance
The measured indicators can be qualitative or quantitative. Qualitative indicators can be performed by on-site-inspection or other kind of personal assetment. Quantitative measures regards mainly time and budget performance. Relevant measurement are made on the early or late actualization of the critical path. The slack of of near-critical path can be measured in relation with the arise of new critical activities. Economical measurement keeps track on the expenditure performance to compare it with the budget values. However, in order to realistically estimate the performance agains time phased budget, we have to consider earned value (budgeted cost of the work performed.) as well. The data are collected based on the performance that the manager or interested stakeholder want to keep track of. Typically the information that are expressed by the data are related to[5]:
- Activity duration and completion status
- Resource usage rate
- Actual cost of resources and activities
Those measures are then compared with the expected duration, usage and costs defined before the activity execution. When projected and actual data are available is then possible to make a comparison and identify possible deviations.
Other Project Performance
However, the performance control process should not just take in account quantitative values. Also inconsistent issues and behaviors can be identified during the execution of project activities in different knowledge areas, such as Project Value, Quality, or Reputation[6]. Sometimes it is not possible to measure the intended metrics as they do not manifest in quantitative values. For this reason are introduced other metrics, used as proxy for measurement purpose. If some deviation manifests (in the schedule, resource, expenditure or other metrics) it should be possible to locate the problem in the organization. The report should be capable to explicate causes and responsibilities for overrun. Additionally the report should indicate the forecast for cost overrun in case of midway overrun.
Technical Performance
In many case technical performance are taken as granted. However, poor performance can have serious consequences on the execution of the project. The scope statement can contain technical specification about the necessary equipment, with indication of criteria and tolerance limits. In any case is usually good practice to monitor performance metrics. This measures may include weight, transaction times, number of delivered defects, storage capacity and other physically measurable indexes. Deviation demonstrate more or less functionality than planned at a milestone and can be used to forecast the degree of success in achieving the project's scope.
Human Performance
At operational level, managers has to create ad-hoc KPIs an monitor the specific working performance through project management information system. The purpose of these KPI is to measure the performance in the execution of specific activities, closely linked to the achievement of organizational goals. In this case, the are defined by the management and their achievement is usually linked with different kind of rewards. The desired target value for KPI has to be set high enough to challenge the employees to fulfill it. At the same time the targets have to be considered achievable by the personnel to be considered meaningful[7].
Comparing Plan against Actual
As the plans rarely manifest exactly as estimated, it is a priority to detect deviations in useful time. The management must be able take corrective actions as soon the deviation manifests. For this reason is imperative to measure periodically the status of the project to compare the actual toward the expected plans. Consequently, the timing of the status must have a frequency that allows early detection and correction of deviations. A good indication is to generate a status report every one to four weeks to be useful and allow to take proactive actions.
Time performance
The project network schedule derived from the WBS/OBS is used as baseline to monitor the current project status. The two graphical tools used for communicating the project schedule status are tracking Gantt chart and control charts. Tracking Gantt chart associates the baseline duration of each past activity to its actual completion. At the same time it displays the remaining duration for ongoing and future activities. Control chart is beneficial when is necessary to underline current and past schedule performance. This graph plots the reporting period on the x-axis and the positive or negative deviation respect the schedule on the y-axis. The result is an outline over time of the difference of the scheduled date in the critical path in the report date with the actual point on the critical path.
Cost Analysis
The traditional cost analysis measurement usually focus on the comparison of earned value (EV) with:
- PV: Expected schedule value, cumulative value of the resource cost estimation in a time phased baseline.
- AC: Actual costs, (of the work completed), the sum of the the cost incurred in accomplishing work.
In the analysis based on earned value and expected schedule value we need to assess planned cost of work scheduled, budgeted cost of work completed and actual cost of work completed. These values are used on periodical basis to calculate schedule variance and cost variance. Cost variance indicates if the work performed costed more or less than expected at any point in the project lifetime. This value can be calculated as difference between actual cost and earned value. Schedule Variance quantifies the progress of work packages in monetary terms. Schedule Variance is calculated by subtracting planned value from earned value[8].
Status Report
A status report is an overview of the process progression for the period in which it has been issued. In each time period are gathered information about each work package completion:
- If the activity has not been performed yet will earn 0% of its PV (time phased value of the work scheduled).
- If the activity has been completed it will earn 100% of its PV.
- If the activity is in execution it will earn the corresponding completion percentage of PV.
Subsequently we can apply the same completion percentage to calculate the Earned Value. Once again it will be finally possible to compute the schedule variance. The data acquired in this way can be used to plot PV,EV and SV (together with actual cost) up to the current period.
Performance Indexes
Many indexes derived from the values mentioned in the previous section can give further insight on efficiency performance and completion in project execution.
| Type | Name | Formula | Meaning |
|---|---|---|---|
| Performance Index | Cost Performance Index | 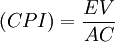
|
Cost Efficiency of the work accomplished to date. This value represent the efficiency of each monetary unit spent in the project. For example if CPI=0.8,it means that for every 8 DKK of value,it was actually spent 10 DKK. The CPI is the most used and accepted index. |
| Scheduling Performance Index | 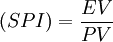
|
Scheduling efficiency to date. This measurement express the percentage of value earned compared to the baseline. Value bigger than one will indicate projects ahead of schedule while value lower than 1 will point at project behind schedule. | |
| Completion Index | Percent complete index (Budget) | 
|
Completion percentage in terms of budget amounts. Where BAC is budgeted cost at completion. |
| Percent complete index (Actual) | 
|
Completion percentage in terms of actual costs. Where EAC is estimated cost at completion. |
Final cost forecast
It is quite likely that a project incur in cost overrun. When this happen, is necessary to revise the final cost estimate and setting a new baseline. In some case examination from expert is sufficient to generate this valuation. This is usually the case for small projects.
In larger project it can be applied a method based on the scaling up the remaing work cost by the cost performance index (CPI). The estimated cost to complete the remaining work is calculated as:
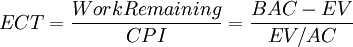
This value, summed with the cumulative cost of the work completed in the assessment date (AC), gives the estimation of total cost at completion.
This method can be combined with the To complete performance index (TCPI):
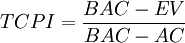
This measure indicates which value should have each monetary unit to remain into the budget. This means that if TCPI is equal to 2, any DDK spent should worth the double to remain in the budget.
Risk limitation
The measurement of performances can both generate and identify criticality within a project. It is important to be aware which is the best measurement setup and how to use the indicators to spot and act on time on variations.
Data acquisition
Sometimes exists a trade-off between data detail and acquisition cost. Supervising the monitoring points used for percentage completion of the project can raise the costs when more personnel is required for the task. Smaller project can reduce this risk by adopting other earned value rules:
- 0/100% rule, short duration work packages switch from 0 to 100 of earned value when the work is completed
- 50/50% rule, half of the value of the work package budget is earned when the work starts, the other half is earned at completion of the work.
Nevertheless, in large process is necessary to use the percent rule to allocate earned value.
Scope variation
Variation of scope are vary common and sometimes unavoidable in the lifetime of a project. These changes can have both internal (e.g. Project Managers decide to change the scope) or external (e.g. due to regulatory change ) causes. Voluntary changes in the scope should occur just when they are necessary for the survival of the project or when they bring significant improvements. From the accounting point of view, past expenditures should not be edited as transfer from different costs account should not be allowed. Changes are often seen with suspicion as when they manifest the organization's cash flow requirement can increase, as effect of more resource needed. However, is not excluded that scope variation can be rewarding, having positive effect on cost and schedule performance.
Baseline variation
When significant variances occurs, managers has to take action to bring back the project in line with the original or revised plan. When the scope changes throughout the project, a new baseline must be set, so to include the new information.
Scope Creep
In some case the scope can undergo significant modification following minor refinements. This phenomenon is called Scope Creep and it is common in early project. Some factors that demands for scope modification can be:
- Customer requirements for additional features
- Embedding a new technology
- Poor design assumption
The baseline is usually unchanged as this modification are not noticed until delay and cost overrun are observed.
Contingency reserve
Before the beginning of every project can be necessary to define a contingency reserve. This found has the purpose of covering unexpected expenses. Its size mirror the risk of the project and it should be directly proportional with the the novelty of the project for the firm.
Notes
- ↑ Project Management: Planning and Control Techniques, Third Edition, Wiley, Chichester, 1999, p. 191
- ↑ https://www.nap.edu/read/11344/chapter/4, 22/09/2017
- ↑ Project Management: Planning and Control Techniques, Third Edition, Wiley, Chichester, 1999, p. 193
- ↑ https://www.defactosoftware.com/erp-software/data-analysis-and-reporting
- ↑ Project Management: The Managerial Process, Third Edition, Clifford Gray and Eric Larson, Mc Graw Hill, 2006, p. 193
- ↑ Definition of a Project Performance Indicators Model: Contribution of Collaborative Engineering Practices, Marcelo Silva Pereira and Rui M. Lima, 2017
- ↑ Jones, G. R., & George, J. M. (2011). Essentials of contemporary management. Boston: McGraw-Hill/Irwin.
- ↑ https://pmstudycircle.com/2012/05/schedule-variance-sv-cost-variance-cv-in-project-cost-management/