This Wiki-page is a selection of tools usable for managing portfolio. In case of any realisation of conflicts, please contact, Andy M Filipovic, s153501@student.dtu.dk
Team members of FLC
| Andy Mattulat
|
Filipovic
|
s153501
|
| Casper Scheel
|
Nielsen
|
s193273
|
| Lucas
|
Gunnersen
|
s161812
|
| Magnus Thor
|
Gunnarsson
|
s193154
|
| Mohammad Sadeq Nateqi
|
Nateqi
|
s143376
|
| Morten Aarkrogh
|
Christensen
|
s193382
|
Introduction
The aim for this wiki page is to put together a selection of tools and methods to help managers and senior managers to obtain transparency into their portfolio of programs and projects. In order to prioritize the portfolio it is urgent to collet and analyse the available information regarding the different projects and programs. Part of portfolio management is to bridge the gap between projects and operations, based upon a informed judgment. Therefor by evaluating value, risk, benefits and other business factors, decision makers can prioritize candidate projects or programs, to access the companies limited resources. [1]
Our collection of tools is intended to help us creating the first step for a portfolio prioritization workflow together with FLSmidth department Group Digital. Group digital at FLSmidth standsfor the digital transformation at FLSmidth. Therefore do this department get projects from all areas of the company, at the same time where they are running their own projects. Since Group digital have limited resources, they see it is a crucial tool, for the future selection of projects to develop a routine for prioritize ongoing and upcoming projects.
Tools
This chapter contains the different tool we intent to use during the portfolio prioritization process.
Each Tool will be supported by 1. a definition, 2. a practical guideline/ how to description, 3. some benefit and limitations, 4. and finally each tool is supported by a link which leads to additional information about the specific tool.
Once again it is important to inform that, portfolio management will not make any decisions of what should be contained by the portfolio and what should be running or stopped. It will, through different tools provide some transparency for senior management to make decisions by informed judgement.[2]
Tool 1: Scoring Method
Definition
The scoring method/model as a basic and highly useful method used by organizations to develop a fast a intuitive overview of projects.
Further explanation of these methods can be found via: [1]
Practical guidelines /how to
The method is made up of a weighting process often comparing financial reward and strategic fit, whereas the projects are rated on simple metrics such as a 1-10 scale or low-to-high scale. The tool is, as mentioned, highly intuitive, whereas the criterias chosen can be customized to fit almost any scoring process.
Further explanation of these methods can be found via: [2]
Benefits and limitations
'
- Easy implementation
- Easily Understood
As mentioned, the tool is simple, whereby it can be deemed as easily understood as well. It doesn't require any additional training in terms of how to use it.
- Can provide great and powerful insight to certain aspects of projects
- Modular
- Intuitive
Further explanation of these methods can be found via: [3]
Tool 2: Bubble Diagram
Definition
The bubble diagram is an illustrational tool used to support decision making in portfolio prioritization as well as other areas. The bubble diagram is a very simple, yet useful tool to map preferential values of a project. The values are mapped on an X-Y matrix, where each axis determine the desired value. The name bubble comes from the actual representation of the values in the matrix.
Further explanation of these methods can be found via: [4]
Practical guidelines /how to
The matrix as described is made up of either several dimensions of data, determined by the complexity of which is chosen. The mapping is often made on two variables, that is compared using the scoring method and mapped using bubbles in the matrix. Some of the variables often mapped against each other are:
Risk vs. Reward,
Strengths vs. Attractiveness,
Cost vs. Benefits,
Strategic vs. Benefit,
Further explanation of these methods can be found via: [5]
Benefits and limitations
Benefits of the tool include:
Benefits
- Easy implementation
The chart in itself is very simple and provided that the input data is suffieciently provided, the implementation stage can be seen as easy.
- Easily Understood
As mentioned, the tool is simple, whereby it can be deemed as easily understood as well. It doesn't require any additional training in terms of how to use it.
- Can provide great and powerful insight to certain aspects of projects
The variables mapped are often pressure points in portfolio management, and by creating an easily understood overview of them can be highly useful.
This said, the bubble chart should maybe not be the only source of data for decisions making.
- Modular
The tool is often done using various software, whereby it can be easily modified on the go, if any changes should occur.
Further explanation of these methods can be found via: [6]
Tool 3: Portfolio selection
Definition
Due to increasing competition and development of technology, more innovative products are being developed by companies. It is a risky path to take, due to uncertainty in its feasibility and future commercial success, which makes each selection and evaluation crucial. Each project selection thus has a high correlation with the survival of a company. The most common methods used to select projects or portfolios are quantitative, qualitative and hybrid methods.
Practical guidelines /how to
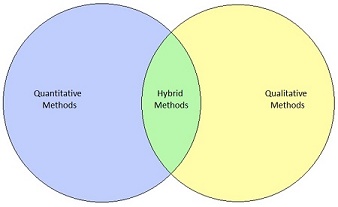
Figure 1. Methods for Project Evaluation and Selection
Quantitative methods:
These approaches focus on numerical information and ignore tacit knowledge and qualitative information. There are several dimensions of quantitative methods, the most common of them being mathematical programming.
Qualitative methods:
The focus of qualitative is to take into account factors that quantitative methods cannot. Some of the most used are bubble diagrams, sensitivity analysis and benchmarking.
Hybrid methods:
These are the most common methods for evaluating and selecting projects and portfolios today. In essence, these are a mix of quantitative and qualitative methods.
Further explanation of these methods can be found via: [7]
Tool 3: Stage-Gate Process
Definition
The Stage-Gate Process is a project management tool that divides the time horizon of a project into several stages. These stages are then separated by gates which represent certain decisions made for the project. The background of the process is derived from the limited resources companies have on their projects, and the need for the development of their project portfolio such that only the most beneficial projects are put through.
Regular Stage-Gate Processes consist of 4 to 8 stages, where at each gate, the evaluation criteria is discussed upfront with the project group and acted upon by the gatekeeper.
Practical guidelines /how to
Stages
There are multiple ways to design the stages in the process, but the following five stages are a typical example that is widely used.
- Preliminary assessment.
- Definition
- Development
- Validation
- Commercialization
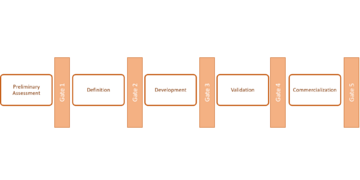
Figure 2: Visualization of the Standardized Steps for using the Stage-Gate Process
[3]
Gates
Where stages typically represent a longer period of time, gates represent meeting which only typically lasts a number of hours. At each gate, the following element are kept in mind.
- Inputs/Deliverables
- Definition
- Outputs
In the output element, usually go/kill/recycle/hold outputs are generated.
This is visualized on figure 2.
Benefits and limitations
The benefits of the Stage-Gate process is that it allows for faster and more adaptive response to market change, high visibility of the project, forces more attention to quality of execution, among other things.
Some limitations to the method are for example that the effectiveness of the method highly depends on the behaviour of the people appointed as senior managers, and that it requires an extensive research to be made by organization when determining criteria at the gates, which can prove to be challenging.
Further explanation of these methods can be found via: [8]
Tool 4: The Analytic Hierarchy Process (AHP)
Definition
The analytic hierarchy process is used to help decision making when working with projects, programs or portfolios, where multiple criteria needs to be considered. The process keeps the decision unbiased and objective by the use of eigenvectors. The functions that are considered in AHP are structuring complexity, measurements and synthesis.
Practical guidelines /how to
When AHP is used in decision making, one will need to go through the 6 steps that is:
1. Define scope
2. Hierarchy
3. Pair wise comparison
4. Scoring and consistency
5. Evaluation of the alternatives
6. Make the decision
Benefits and limitations
The benefit of AHP is its ability to handle more criteria than the human mind can, which will increase the amount of correct decisions made. Furthermore AHP decreases the amount of subjectivity used to make decisions as it leaves out biases. AHP is a time-consuming process the first time it is used, however after several uses it is more easily applied.
Further explanation of these methods can be found via: [9]
Tool 5: Innovation Portfolio Management (IPM)
Definition
The concept behind innovation portfolio management (IPM) is to bring innovative products to the market that is in line with the strategic vision of the company. It does this by using four main goals, which are strategic alignment, maximizing portfolio value, balancing number of projects and balancing time frame of the projects.
Practical guidelines /how to
IPM is best utilized by splitting the work into a strategic and an operational part, each having two activities to be controlled.
Strategic innovation portfolio management (SIPM) covers balancing of the portfolio by different criteria. Secondly the projects of the portfolio is evaluated and prioritized in a cyclic manner.
Operational innovation portfolio management (OIPM) has the activities of tactical resource allocation and constant review and adjustment of products in the portfolio.
Benefits and limitations
A benefit of IPM is that it gives the company high flexibility as it is routinely reviewing and adjusting the portfolio to fit changes of the market. However IPM has not been used by many companies and is still a new method to be used in the industry. This creates some uncertainty as the method has not been tested thoroughly yet.
Further explanation of these methods can be found via: [10]
Tool 6: Interdependence Model
Definition
This model functions to visualize the dependencies interacting between projects, these dependencies is divided into three different fields. Resource, Strategic and Knowledge depedency, resource defines the link between resources such as employees or finances, strategic is the connection between a common collaboration of projects to achieve a strategic goal, knowledge is when projects requires the same knowledge.
Practical guidelines /how to
The model is applied in a "Risk Opportunity Identification Framework" as a part of 6 steps:
1. Definition Step
2. Modelling Step – “Interdependence Model & System-Environment model”
3. Identification based on interdependences
4. Identifcation based on system-environment search
5. Iterations
6. Portfolio risk opportunity register output – Risk oppurtunity register model
Benefits and limitations
Its an essential step in gaining a common overview of the project interconnection in the organization, it is crucial that every member which is a part of the framework application has a common understanding of the dependencies inbetween projects.
Further explanation of these methods can be found via: [11]
Tool 7: System-Environment Model
Definition
This model functions of five elements which is defined to gain an overview of the portfolio investigated, as seen on the figure it defines the environment surrounding the project portfolio which functions to give an understanding of the odds of succeding in terms of organizational goals. The model is defined by Input, Output, Throughput, Feedback and the environment.
Practical guidelines /how to
The model is applied in a "Risk Opportunity Identification Framework" as a part of 6 steps:
1. Definition Step
2. Modelling Step – Interdependence Model & System-Environment model is applied
3. Identification based on interdependences
4. Identifcation based on system-environment search
5. Iterations
6. Portfolio risk opportunity register output – Risk opportunity register model is applied
Benefits and limitations
Defines an overview of the influencial factos which can oppose a risk to the portfolio success, as previously mentioned it is a step of a predefined framework which will allow the user to gain an overview and awareness of its issues.
Further explanation of these methods can be found via: [12]
Tool 8: Risk Opportunity Register Model
Definition
This model is the final step of the risk opportunity framework which functions to display the financial and strategic consequences each project is evaluated to potentially could impact the organization, by the implementation of the before mentioned models it should give an idea of the severity of each project.
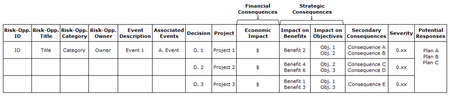
The risk opportunity register model
Practical guidelines /how to
The model is applied in a "Risk Opportunity Identification Framework" as a part of 6 steps:
1. Definition Step
2. Modelling Step – “Interdependence Model & System-Environment model”
3. Identification based on interdependences
4. Identifcation based on system-environment search
5. Iterations
6. Portfolio risk opportunity register output – Risk opportunity register model
Benefits and limitations
This model is beneficial as a supporter to the final decision making as it displays the overall results of the framework and potentially should imply which projects to prioritize and invest their time and finances into.
Further explanation of these methods can be found via: [13]
Tool 9: The Balanced Scorecard
Definition
The Balanced Scorecard (BSC) is a system used to review the performance of a certain project or daily practices from four perspectives; Financial perspective, Customer perspective, Internal Process perspective and Learning and Growth perspective. BSC can be a useful tool for Project Portfolio Managers to connect the project portfolio with organizational strategy.
Further explanation of these methods can be found via: [14]
Practical guidelines /how to
1. Preparation
In preparation an organization must define the business unit. A BSC is only appropriate for a business unit with its own customer, production, distribution etc.
2. Interviews: First Round
Senior executives in the business unit receives documents on vision, mission and strategy. Every executive is then interviewed to obtain their input on the different aspects of the company.
3. Executive Workshop: First Round
Top management team together with the BSC facilitator develops the scorecard. Here the group debates the results from the interviews regarding mission and strategy until a consensus is reached. Key succes factors are then defined and the group hereby creates a draft of the balanced scorecard containing measures for strategic objectives.
4. Interviews: Second Round
The conductor of the BSC reviews, consolidates and documents the output from the workshops and interviews each senior executive regarding the BSC draft.
5. Non-executive Workshop: Second Round
A second workshop including the senior management team and middle managers to debate the same topics as in the executive workshop. Here the purpose is also to get the non-executives to formulate a set of objectives for each of the proposed measures by the executive team and possible improvements.
6. Executive Workshop: Third Round
The senior executive team meets one final time for consensus on the official vision, objectives, and measurements. In order to fulfill the measures on the scorecard and to define the first actions the team must agree on an implementation program including the communication of the scorecard to employees, looking at the scorecard as a management philosophy and a system to support the BSC.
7. Implementation
A team is formed with the purpose to define an implementation plan for the scorecard, linking the measures agreed on in the workshops to the information system and communicating the BSC to every part of the organization.
8. Periodic Reviews
A timeframe is set to conduct periodic reviews. The BSC measures are revisited.
Further explanation of these methods can be found via: [15]
Benefits and limitations
From the perspective of project portfolio management the benefits of this system is that the BSC provides a record of the strategic initiatives, and from there it is possible to start analyzing, evaluating, prioritizing, planning, and depending on the case, executing the projects that will make the mission and vision of the organization something tangible
Limitations:
'
- Rigidity
- Confirmation Bias
- Complexity & resource intensive nature
- Limitations in Learning & Growth
- Insufficiency in describing the business complexity
Further explanation of these methods can be found via: [16]
References
- ↑ Levine, H. a. (2005). " Project Portfolio Management : A Practical Guide To Selecting Projects , Managing Portfolios and Maximizing Benefits.". Management.
- ↑ Kilford, C. (2011). " Management of Portfolios".TSO.
- ↑ Cooper, R.G. (1990). Stage-Gate Systems: A New Tool for Managing New Products. Business Horizons. pp 44-54


