Project Schedule development
Contents |
Abstract
Managing and organizing activities to achieve a desired goals require a structured approach, as well as systematic and regularity. The article focuses on one of the segments of Time Management, namely project schedule development (PSD). It presents the importance of this aspect in terms of supporting project managers along with a project. It introduces the philosophy of scheduling and proposes a way of executing the mentioned segment.
Even though the process starts at an early stage, it is inseparable part and accompanies a project manager to an end of a project. Developing a high-quality schedule requires time, sufficient input, analysing activities and resources [1]. In order to provide expected results, based on PMBOK@ Guide, technique and the methodology were presented, highlighting one of the methods: Critical Path Method (CPM). Proper application of tools leads to a fully developed schedule of all activities included in a project. Structured proceeding improves teamwork, communication and allows for better performing during a project life cycle. A sequential plan helps in controlling and reaching previously established targets.
Motivation
There are many reasons behind project schedule development to be taken with appropriate caution while planning time frame of a project. First of all, it provides in structure way the scheme and toolkit for planned activities. Following the guidelines, it allows to build a sufficiently detailed plan of actions with the time-frame for each activity, enable tracking the progress and updating a schedule if necessary. Secondly, transparency and overview of planned action increase efficiency and support maintaining sufficient communication flow. More organized work often results in increased motivation, awareness of the project, as well as, gives a sense of stability among employees. At last but not least, PSD implemented correctly decrease the risk of delays, helps allocated resources, which may result in minimizing potential costs of the project.
Introduction
Project Time Management
Project Time Management is defined as set of processes with outputs to ensure all the activities throughout the project are accomplished on time.[2].. It is about increasing both efficiency and effectiveness and to control over the time spent on the particular tasks. As one of the key Project Management areas, the process plays a major role in each out of five project phases. It reflects to the overall performance during the project life cycle as well as the individual task consumption.“Control of time is competitive advantage”[3], wisely used can increase benefits and decrease the costs of a project.

As it is shown in Figure 1. according to PMBOK, The Time Project Management consists of :
- Active Definition- defining particular tasks necessary to accomplished project's goals.
- Activity Sequencing- defining dependencies between project's tasks.
- Activity Duration Estimating- estimating the number of work periods that will be needed to execute individual task.
- Schedule Development- evaluating the sequences of the tasks, its duration and resources requirements in order to prepare the project schedule.
- Schedule Control- monitoring variations to the project schedule.
(different sources: PMI[5] divides it into 4 areas: Time Planning, Time Estimating, Time Scheduling and Time Control).
The overview is meant to be standardized for general purpose of the all project, however based on close connection between Activity Sequencing,Duration Estimating and Development, they may be treated as one process, especially in small projects.[6].
Schedule Development
As the project has starting and finishing date as the project's activities should have them as well. It is essential to define a beginning and a end time of the individual work during life cycle of the project in Project Management. Therefore, Schedule Development as a one of the core processes in Planning Processes[7] should be proceed with details and after analyzing key activities. With its nature to recognize the realistic time and resources limitations, Scheduling takes both into account while preparing the plan. Since the base line of the schedule is affected by many factors, executing this process, PMs should have in mind that the procedure must be iterated.
The flow of Schedule Development is determined by the steps (see Figure 1.) :
1.Inputs
  1.1 Project network diagram- visual overview of the sequence and dependency(relation) between the activities.
  1.2 Activity duration estimates- estimating the number of work periods that will be needed to execute individual task.
  1.3 Resource requirements- Quantity and type of resources required for each activities from Work Breakdown Structure (WBS)
  1.4 Resource pool description- Quantitative and type availability of resources during project.
  1.5 Calendars- Defining periods when work is allowed
  1.6 Constrains- Limitations that affects project's team work. There are two main types :
      1.6.1 Imposed dates,
      1.6.2 Key events and major milestones.
  1.7 Assumptions- hypothesis and beliefs, which are taken for granted for the purpose of the project
  1.8 Leads and Lags- Dependencies between predecessor and successor activities
2. Tools and Techniques
  2.1 Mathematical Analysis- based on theoretical calculations of starts and finishes of the activities (without taking under consideration any constrains) it provides the time windows where particular activity should be proceed. As most known methods includes:
     2.1.1 Critical Path Method (CPM)
     2.1.2 Graphical Evaluation and Review Technique (GERT)
     2.1.3 Program Evaluation and Review Technique (PERT)
  2.2 Duration compression- Process used to shorten duration of the activities without interfering into the scope of the project. Methods included in the process :
      2.2.1 Craching
      2.2.2 Fast Tracking
  2.3 Simulation- Based on assumptions multiple duration of the activities are calculated. The most known simulation is Monte Carlo Analysis.
  2.4 Resource leveling heuristics- based on resources constrains and limitation, start and end dates of the activities are adjusted.
  2.5 Project Management software- These products allows to speed up above calculation by automating the processes
3. Outputs
  3.1 Project schedule- Plan of the start and finish of each planned activity. It is shown either as table or more often as a graph like :
      3.1.1 Project Network Diagrams
      3.1.2 Gantt Charts
      3.1.3 Milestone Charts
      3.1.4 Time-scaled Network Diagrams.
  3.2 Supporting detail- All assumptions and constrains related to the project,plus additional details differ on project type.
  3.3 Schedule management plan- Description how the changes in the schedule are managed.
  3.4 Ressource requirement updates- see point 1.4
Application of Mathematical Analysis based on PMBOK@ Guide
Critical Path Method
Critical Path method (CPM)' is used as a tool for scheduling activities for executing projects. It allows to determine activities with the highest impact for project. These activities are call critical and it means, that they play such a role in a whole sequences of tasks that, their delay will cause delay for the entire project. Therefore, defining CPM at the early stage and securing these activities to the possible extend, significantly decrease a risk of missing deadlines during life of a project. In order to structure the method correctly, it is important to follow these steps below [8]

- Step 1.List of activities In terms of preparation of defining critical path all activities included in project must be listed. Next to activities detail information about its sequence and duration must be provided. Figure
- Step 2.Precedence Diagram It is visual representation of sequences. That diagram allows to allocate each activity showing clearly realtion between predecessor and successor.
- Step 3.Active-on-node diagram
Originally CPM was supported by PERT, but nowadays it was replaced byactive-on-node diagram and PERT-like estimations are rarely used[10].
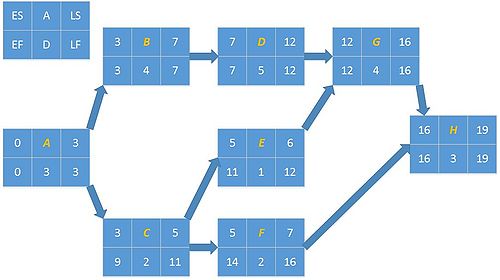 Figure 3: Active-on-node diagram adapted from Engineering4free [11]
In the left-top corner there is a legend that describes content of each box in a node. Abbreviations meaning :
- A-Activity. In the boxes is marked as Orange letter and it defines particular activity with its details.
- D-Duration.
- ES - Earliest start, which is a value from Early Finish (EF) of the predecessor of that particular activity :EF of activity A is equal to 3, and activities B and C are its successors, so their ES is equal to 3 .
- EF-Earliest Finish, which is sum of ES and D. ES+D=EF
- LS-Latest Start for particular activity.
- lF-Latest Finish, which is sum of ES and D. LS+D=LF
As a first step in executing the diagram, ES and EF are necessary to be calculated. For example as it is shown in Figure 3., activity A has ES=0 and D=3, so EF=3+0=3. Then ES of activity B is 3, because EF of its predecessor is 3. When there is only one predecessor for the activity the methodology is straight forward and easy to follow. However, when activity has more than one predecessor, only one value of EF can be chosen. The rules says to choose GREATER EF of all options[12]. It is important regarding defining the longest path( See Figure 4.). Calculation are repeated till the last activity.
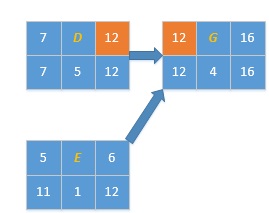 Figure 4: GreaterEF
When calculation forward is completed, calculation backward may start. Procedure is very similar, but now starting activity is the last one in the project. EF of activity H becomes also LF of its activity, which means any delay in project, postpone its ending. In terms of calculating LS, LF of H activity must be subtracted with D. LS=LF-D. Then, LS of the activity H becomes LF of predecessor activity. When there is only one successor for the activity the methodology is straight forward and easy to follow. However, when activity has more than one successor, only one value of LF can be chosen. The rules says to choose LOWER LF of all options[13].
- Step 4.Define Critical Path After all calculation are finish, critical path may be defined. Beginning from activity A, critical path is the one with activities having EF=LF. From Figure 3. can be noticed that critical activities are : A, B,D,G,H. That equality results in no flexibility for these particular activities regarding time. If delay occur in at least on of the tasks included in a path, a date of finishing a project is delayed as well. Activities not included in CP have so called Float or Slack. Difference between LF and EF in these tasks shows amount of time, a project can be delayed without affecting overall finishing date for a project. For example activitie C : LT-EF= 11-5=6. IF a delay happens during that task and it takes less 6 days, a project is still finished on time.


Properly prepared CMP allows to define activities, which can have the biggest impact regarding time and highlights where PM's attention should focus on. Regardless to that, CMP does not include factors like : resources availability or resources leveling. Additionally, time calculation are based on estimation and it may change the schedule. Luckily, the method stands out with its flexibility and and ability to adjust, which make it a handy tool in PM's toolkit during schedule development.
Outputs
Project Schedule
Project schedule is a list of deliverables, targets, milestones and activities, preferably with their dates of execution. It is built based on many related factors affecting the project. Designing a schedule resources allocation, task duration, budget, and task dependency are taken into account. That is why proper preparation of data and input factors (see figure 1.) are essential in order to establish a real project schedule. As the project schedule meant to reflect the actual status of the project it has to be updated. That kind of document are meant to be sensitive for the changes and all unplanned delays, reschedules acceleration of operation should put on the plan. That can prevent from confusion and decrease the amount of future changes in the plan
Regarding medium and large size projects or project with highly complexity, preferable result is so called Project Master Schedule. When it comes to manage and control all level tasks in projects it is important to have and general overview. Some deliverables require more activities and planning then others. Therefore, individual schedules focusing on specific part of a project. Hence, PMS is a visual summary of key targets defined in a project[14]. Regardless, time and budget required preparing PMS, benefits for PM are undeniable. It allows efficiently coordinate tasks and support maintaining on track with an overall schedule. It might be presented in many different forms, most common once
There are numerous tools, which may be found useful in visualizing task sequence and dependence among them. Choosing the suitable one depends on PM's preferences and features are to be highlighted. Few of most common once are briefly introduced below, based on PMBOK® Guide suggestion:
Project Network Diagram' is graphical illustration of tasks order and relations between them. It may present either a whole project or its part. Diagram should be readable for everyone, therefore it should be followed by description of the shown sequences. WBS output is clearly visible, while preparing diagram. PND is often confused with PERT Chart ( Program Evaluation and Review Technique), which is special kind of PND and proposed as one of the tools by PMBOK® Guide while building project schedule. [15].
Gantt Chart is a bar chart presents what and when activities take place as well as how long it takes to finish the task according to a plan. Compering to PND in Gantt charts user can spotted overlaps in time of the activities. Utilization of that feature finds its usefulness in tracking parallely executed tasks. Regarding the need charts can be enriched with more detailed information, like task owner.
Milestone Charts display main deliverables during life cycle of the project. Unlike Gantt charts, its only shows the exact date when particular target should be achieved. Milestones are the result of accomplishment of certain activities in certain period of time. Fulfilling milestones requirements is often treated as a performance measurement and reflects accuracy in executing a project regarding established schedule.
Time-scaled Network Diagram is a combination of network diagram and bar chart. That merger means that bar chart follows schedule network logic. As a result, activities on diagram based one their position and length reflect their duration. Difficulty of that method lays in the special manner of drawing a diagram .Thus, preparing the graph, description or short introduction is necessary in terms of common use and understanding.
Apart of mentions methods, PMs may find may others tools in their toolkit. Based on best practice in many companies methods are standardized and templates for the diagrams are prepared. That simplicity ensure common understanding and generality of the outputs, which are crucial for the communication flow inside projects in organizations.
Schedule management plan
Whenever changes are need to be applied, the focus is on being adhere to the former version of schedule. Schedule management plan is a supportive document that can be qualify as formal or informal item for the overall project schedule. it describes key indicators that are crucial in terms of managing the changes in the schedule and maintaining consistency in developing new one.
Resources requirements update
As the necessary resources based on type and quantity were defined and allocated, it is important to keep on track with their current status. In many companies the amount of needed resources are represented as a number of working hours- a Full Time Equivalent (FTE). For instance, when an activity is evaluated as 0.8 FTE weekly, it means that 29,6h (0,8*37 working hours a week) of Full Time Employee time is necessary to execute that task in given time. Thus, differences in accessibility to resources directly influent timetable of the project. Therefore, all the changes in availability of resources are crucial to be updated, and reflected on the activities schedule.
Limitation of PSD
Methodology described above allows in clear and convenient way schedule the activities for the the project, however as every process it has its weakness and limitations:
1.Changing the scope: Activities defined before scheduling are simply based on the scope of the project in terms of delivering desire deliverable. Nonetheless, it is unhightly likely that the scope remains the same through the whole life cycle of the project. Changing the scope means also defining new or re-defining existing activities, which in results affects the outputs out of Schedule Development.
2. Decreased budget: For the Schedule Developments means that duration of some activities need to be shorten and resources reallocated.
3. Since projects environment is dynamic and in constant change, there is no Schedule Development tool or method , which can build 100% accurate time-frame. Projects are affected and influence by multiple factors, which ends up with readjusting or iterating the plan.
Glossary
References
- ↑ Page 31, 1996 ed. PMBOK® Guide
- ↑ Page 59, 1996 ed. PMBOK® Guide.
- ↑ https://www.pmi.org/learning/featured-topics/time. Retrieved 11 February 2018
- ↑ Page 60, 1996 ed. PMBOK® Guide
- ↑ https://www.pmi.org/learning/library/time-management-project-functions-schedules-5283. Retrieved 11 February 2018
- ↑ Page 60, 1996 ed. PMBOK® Guide.
- ↑ Page 47, 1996 ed. PMBOK® Guide
- ↑ https://web.archive.org/web/20100612142236/http://hspm.sph.sc.edu/COURSES/J716/CPM/CPM.html Retrieved 25 February 2018
- ↑ https://www.pmi.org/learning/library/time-management-project-functions-schedules-5283. Retrieved 25 February 2018
- ↑ Page 60, 1996 ed. PMBOK® Guide.
- ↑ https://www.pmi.org/learning/library/time-management-project-functions-schedules-5283. Retrieved 25 February 2018
- ↑ https://books.google.it/books?id=-RtUAQAAQBAJ&lpg=PR2&dq=Gail%20Thornley%2C%202001%2C%20Critical%20Path%20Analysis%20in%20Practice%3A%20Collected%20papers%20on%20project%20control%2C%20Oxon.&hl=it&pg=PA3#v=onepage&q&f=false. Retrieved 25 February 2018
- ↑ https://books.google.it/books?id=-RtUAQAAQBAJ&lpg=PR2&dq=Gail%20Thornley%2C%202001%2C%20Critical%20Path%20Analysis%20in%20Practice%3A%20Collected%20papers%20on%20project%20control%2C%20Oxon.&hl=it&pg=PA3#v=onepage&q&f=false. Retrieved 25 February 2018
- ↑ https://www.pmi.org/learning/library/fundamentals-master-scheduling-project-manager-1809. Retrieved 23 February 2018
- ↑ Page 64, 1996 ed. PMBOK® Guide