Resources loading, leveling and crashing
Developed by Piotr Mieszalo
Contents |
Abstract
The current business trends aim to achieve the operational excellence by maximizing the profit while minimizing the cost and completion time. This has a profound impact on project managers forcing them to operate more and more efficiently. However, most of the project management systems used today tend to limit the efficiency due to the lack of data consistency and reliability. In consequence companies spend substantial amount of resources trying to standardize and integrate processes. As resources are needed by activities, activities produce products, products constitute projects, and projects make up organizations. Thus, resource management can be viewed as a basic component of the management of any project. The most effective integration of resource with schedule systems can be achieved with 3 methods. Resource loading provides information about period-to-period constraints on resources over the project duration. Resource leveling seeks to improve the resource utilization, while reducing the total cost of the project. Finally, crashing is a schedule compression tool allowing to reach the project scope in the critical duration. Together these tools provide control over the project schedule, allowing to predict the final outcome more accurately.
Resource planning in the project management lifecycle
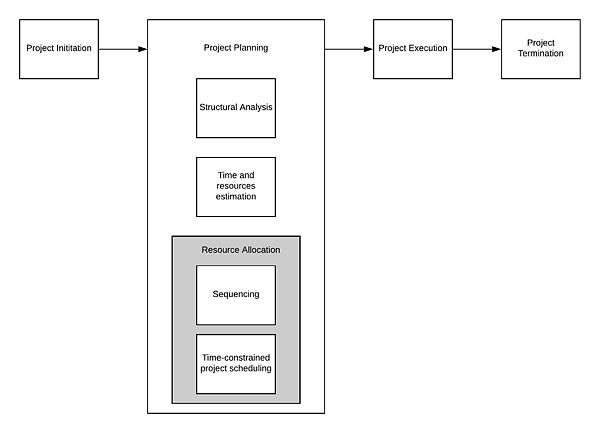
According to the Life Cycle Model, a project consists of the 4 established stages: project initiation, project planning, project execution and closure. Each phase in the project life cycle requires specific project management techniques.
Project planning at first decomposes the projects tasks into the ordered list of activities that are defined by structural analysis of the project such as Work Breakdown Structure (WBS). Each of the activities is later collated together with the time duration and resources requirements. Together they form the representation of project as a network modelling activities with the preceding and following activities. Collating them together with the available slack time allows to create the initial starting time and end date in the project schedule. Finally, the optimal resources are allocated to each activity providing a reliable schedule for successful project execution. The last step is the most complex step in the project planning, which is why different methods were developed to deal with time and resource constrained schedules.
Basic Scheduling techniques in Project Management such as The Critical Path Method (CPM) or PERT assume the unlimited resource availability in the project network. In reality, both the time and resource requirements need to be properly allocated while developing network schedules. Projects are subjected to three major constraints:
- Time limitation
- Resource availability
- Performance requirements
Satisfying all three criteria at the same time are typically impossible to perform without trade-offs. That has risen a need for reliable resource allocation methods that could facilitate project completion, resource utlization, cost estimation and other inconsistencies in a project schedule. Resource loading, leveling and crashing are the methods developed to answer this need. Taking different strategies each of this method strive to tackle the project planning problem with relevant time and resource optimization tools.
Resource Loading
Resource loading identifies the amount of project resources required over the project lifecycle. The critical point of this method is that there are definite limitations on the amount of resources available to carry out the project under time consideration. Due to that fact, the project duration may increase beyond the initially estimated end-date. The overall objective of resource loading is to minimize the duration of the project being scheduled subjected to the stated constraints on available resources. Because of resource and time constraints resource loading is the most commonly disseminated method in the project planning. Resource loading can be also refered as constrained-resource scheduling or limited resource allocation.
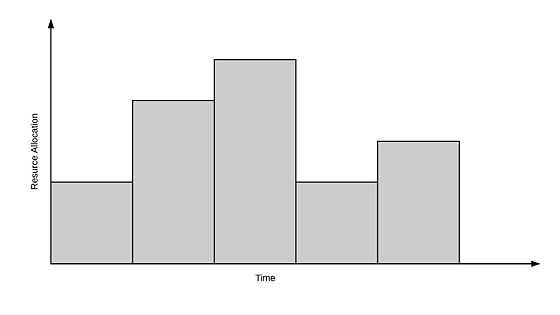
Resource loading can be conveniently presented as the graphical representation of resource allocation over time. This gives an indication of the demand a project will take place on the organization's resources.
The graph can be adapted to show number of critical information [1] regarding the project plan such as:
- Variation in the resource allocation overtime provides information about the depletion rate
- Show areas of resource conflicts when presenting the allocation of various resources
- Show the level of load on the resource if it was assigned to different activities at onc
Loading the schedule with necessary resources by activities allows it to become the driver of project planning, status and performance.
Resource Leveling
Hills and valleys in resource requirements generally represent inefficiencies, so efforts must be made to “level” the resource allocation in a schedule. Resource leveling is the optimization technique used to adjust the schedule model to the demand and supply fluctuations. It adapts the start and finish dates based on the resource constraints with a goal of balancing demand for resources with the supply on-hand. The method can be used when the required resources are available only during certain period or in limited quantity. It is also used to balance the resource consumption level. [2]
Burgess Method
A systematic procedure for leveling resources was developed by Burgess and Killebrew in 1962. The so-called Burgess method utilizes a simple measure of effectiveness given by the sum of squares of the resource requirements for each of the activities in the project schedule. [3] While the sum of resource requirements over the project duration is fixed, the sum of squares of resource-units requirements decreases as the peaks and valleys are leveled.
- List the project activities in the preceding order. Add to the list a duration, an early start and a relevant slack for each activity.
- Start with the last activity, schedule it to give the lowest sum of squares of resources requirements for each time unit. If more than one schedule gives the same total amount of squares, schedule the activity as late as possible to provide more slack to the preceding activities.
- Fix the last modified activity and proceed with Step 2 to the next last activity in the network, taking advantage of slack available after the previous step.
- Continue with the previous step until the 1st activity of the list is reached. Once the 1st activity is rescheduled, the first reschedule cycle is completed.
- Continue with additional rescheduling cycles repeating steps from 2 to 4 until no further reduction in the total sum of squares of resource requirements can be made.
- Choose the best schedule obtained.
- Make final adjustments to the chosen schedule in Step 6 by taking into considerations factors and requirements that were not considered in the initial scheduling procedure.
The results of Burgess method is easily visualized with a resource-idelness graph that is simmilar to resource loading graph. The area covered by the resource idelness graph can be used as a measure of the effectiveness of the scheduling strategy employed for the project. Two scheduling strategies presented below yields the same project duration of 12 time units.
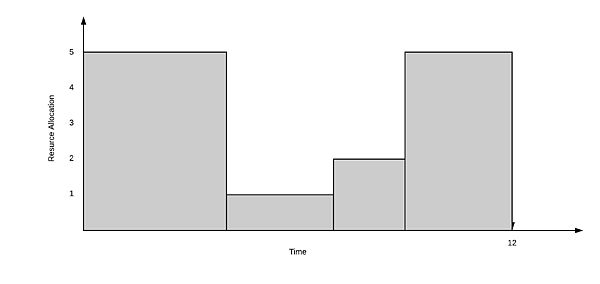
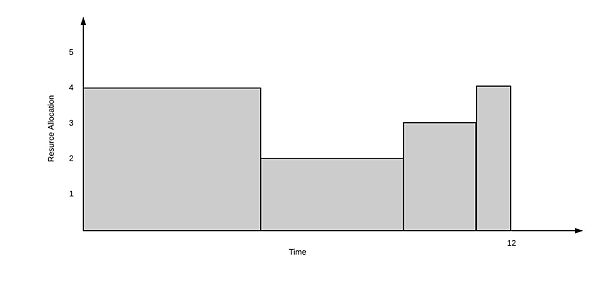
To compare these a measure of the resource utilization under each strategy will be performed for each of the resource-idleness graphs. The effective area is calculated as following:


The Area of 1st strategy consists of more of the resource-time units than the Area of 2nd strategy. Therefore, it is concluded that the leveled 2nd strategy is is more effective in terms of resource utilization than strategy 1. Similar measures can be adopted for the projects with multiple resources. However, for multiple resources; the different resource units must all be scaled to dimensionless quantities before computing the areas bounded by the resource idleness graphs. This assumes that all resources are equally costly or critical. If one resource is much more expensive it can be weighted to indicate the relative significance.
Overall, the advantages of resource leveling include simplified resource tracking and control, low cost of resource management and increased opportunity for learning. However, acceptable resource leveling is typically obtained at the expense of longer project duration.[4]
Crashing
Crashing is a method used to analyze and choose the most cost-efficient measurements of compressing the project duration.Crashing is a schedule compression technique used to meet schedule constraints, dates and other objectives without compromising the project scope.[5] This can be done by utilizing extra resources like: approving overtime hours, bringing the additional resources or expediting delivery of activities to reach the critical path. The traditional method of crashing PERT networks ignores the stochastic nature characterizing activity's completion time. The crashing method uses the activity time means in calculations to reduce the stochastic model to a deterministic CPM model. A single critical path is then calculated and implemented, while in reality, there may be more than one critical paths.
As a compression technique, crashing focus on the project schedule in an effort to speed up the project's completion date. Circumstances that facilitates crashing include the following:
- Over-time
- Allocating additional resources to specific activities
- Hiring additional workforce
- Benefits payments for early completion
- Penalty for late completion
- Outsourcing portions of the project to be completed within a shorter time period compared to completion time with internal resources
Process
It is in the project manager interest to crash the project in a way that would speed up the project with the smallest cost possible. The basic processes involved in the crashing[6] includes:
- Define the project logic.
The project precedence diagram can be developed, based on either logic driven or resource-driven constraints, once the WBS is known. - Add the duration for each activity.
Determine and assign appropriate time duration to each of the activity. - Establish the project critical path.
Critical path is of primary importance as there is no point in crashing the non-critical activities that would simply increase costs without any time saving benefits. - Calculate the cost of crashing each activity.
This is defined as a function of resources and availability. The duration and cost of each of the activity will be calculated first for normal and then for crash scenario. The crash cost can be calculated by the use of extra resources understood as workforce and other overhead cost such as supply or fuel required to accomplish given activity. - Calculate cost of crashing per unit time.
This is calculated by dividing the crash cost of a given activity by its crash duration expressed in weeks or days. - Calculate crash sequence.
The crash sequence is determined by finding the cheapest unit crash cost activity preceding the more expensive unit-crash cost activity. The sequence will appear as a negative curve, rising more steeply while moving away from the origin, which represents original project time and cost. The curve should always rise more and more steeply as the unit crash cost increases for the later items, producing a cumulative effect that is more and more costly. - Check the critical path.
Crashing the path activities will reduce the overall length of the critical paths. Due to that reason, it may turn out that the original critical path will no longer be critical, as it becomes shorter than the other parallel paths through the network. Since that, the critical part needs to be checked after each crash to ensure about its criticality. If the path becomes critical before the crash limit has been reached, then the entire crashing process needs to be repeated until a new critical path is identified. Once any critical path in the network becomes fully crashed, the process is ended. - Crash the network to the crash limit
The crash limit defines the point in which no further crashing can be performed. It is generally considered that all of the activities on the critical path can be crashed while still remaining on it. The crash curve will shape intoa typical time-cost curve, where each of the activity on the curve will show the time-cost trade-off alternative.
Time-Cost Curve
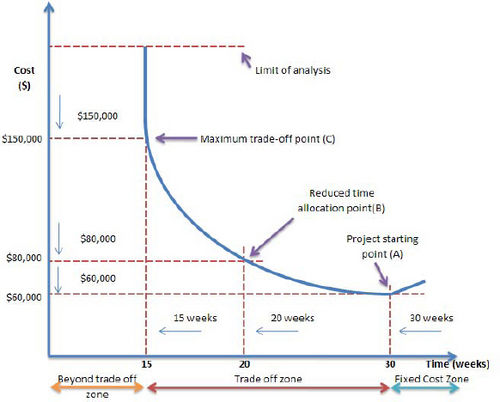
To determine a desirable degree of crashing a use of time-cost graph may provide valuable insights on how does the total cost of the project change depending on the project duration. The graph indicates that the faster the project will be finished, then cost of the project will increase exponentially. Respectively, the project cost will decrease to the project duration increase, but only until the point when no more trade-offs can be made.
The main points characterizing the time-cost curve are:
- Optimum cost point (A) - the project starting point showing the lowest cost established in a given time period. This point corresponds to the original critical path used in the project and the initial agreement on the project cost and duration.
- First crash point (B) - the point in which the project can be crashed with the cost of crashing per unit time activity. Crashing the corresponding activity in the path results in the most effective project time compression for the smallest increase of cost. From this point on, the curve becomes steeper meaning that any further compression will be achieved only at the higher cost.
- Maximum crash point (C) - the point at which all critical paths in the networks have been crashed to their limits. At this point crashing the remaining non-critical activities, will increase the overall cost, but have no impact on the time duration
- Fixed overhead curve - region in which additional time for the project is allowed, but no cost saving benefits can be accomplished. This is due to the reason that the overhead cost increase with the time duration.
Limitations
The general approach used to deal with resource and time based constraints in the project scheduling can be summarized in two steps:
- Set activity priorities according to some criterion
- Schedule activities in the specified orders with respect to preceding activities and resource availability
The methods presented in this article shows three different perspective on how to tackle time limitation, resource availability and performance requirements when dealing with project schedule. Resource loading allows to identify the required resource allocation during the project duration. It's graphical representation of this method gives a clear understanding of how does the project will affect the organization's resources availability over time. Resource levelling is a reliable method to deal with resource fluctuations beyond the acceptable level. The Burgess Method used in the process reduces the period-to-period variations observed in the resource loading method. The goal of this technique is to minimize the sum of square for the resource requirements in each periods. This allows to achieve the higher resource utilization, while simultaneously simplifying the process of resource tracking, controlling and management. However these benefits come often at the cost of extended project duration. Crashing, on the other hand, is a method aiming to compress the project duration without compromising the project . Cost-effective analysis of the activities through crash curve provides guidelines for the project for managers on how to utilize the internal resources to expedite the project delivery to reach the critical path.
Regardless the choice of the method, the overall point of this article signifies the strong dependence between resource and time management in the project planning. Therefore, the actual challenge is not the choice of one method over another, but rather finding a desiered degree between cost and time trade-offs in the project schedule optimization.
Annotated Bibliography
Project Management Institute, A Guide to the Project Management Body of Knowledge (PMBOK® Guide) - The book provides basic understanding about resource planning concept emphasizing its relevance in the project planning stage.
Badiru, A. B. (1993), Activity-resource assignments using critical resource diagramming - The article neatly summarizes the resource allocation problem, giving a good insight into both resource loading and resource leveling and relationship between each others.
Kelly, É. V. (2011), Crash with confidence - the article covers in the details the crashing process, its different stages and its impact on the cost-time aspects of the project.
References
- ↑ Adedeji Bodunde Badiru. Managing Industrial Development Projects: A Project Management Approach, (John Wiley & Sons, 1993), 166
- ↑ "6.6.2.4 Resource Optimization Techniques",A Guide to the Project Management Body of Knowledge (PMBOK® Guide), (Project Management Institute, 2013), 179.
- ↑ Badiru, A. B. (1993). Activity-resource assignments using critical resource diagramming, Project Management Journal, 24(3), 15–21. [Available online]
- ↑ Adedeji Badiru, Abidemi Badiru, Adetokunboh Badiru,Industrial Project Management: Concepts, Tools, and Techniques,(CRC Press, 2007), 124
- ↑ B. Tonnquist & J.Hørluck, Project Management - a complete guide, (Academica,2009), 134.
- ↑ Kelly, É. V. (2011). Crash with confidence. Paper presented at PMI® Global Congress 2011—EMEA, Dublin, Leinster, Ireland. Newtown Square, PA: Project Management Institute. [Available online]
