Risk matrix
Developed by Artem Chernyshev
To successfully execute its projects, especially in surrounding unstable environment, the companies, need to be aware about significant uncertainties, which will undoubtedly face projects during different stages of its life cycle regardless its complexity and time completion.
The uncertainties imply risks of (generally adverse) events those effect on the outcome or/and objectives of projects. In order to understand the variety of risks that a project face Risk Management [1] activities in a project need to be performed. Effective project management need to identify what types of risk may influence particular stage of project. Furthermore, the management have to analyze and prioritize risks in terms of most severity and perform decision making in order to treat the risk and finally treat relevant risks in a structured way in order to avoid or at least mitigate any harm that may cause this certain risk.
However, how to decide and prioritize which risk is more dangerous and need to be treat first?
The one of the useful risk assessment tool supports project management to decide which risk need to be consider at first called “Risk Matrix” or also known as “Probability and Impact Matrix”. It is a common graphical tool used to simply and quickly visualize and categorize already identified risks, source of risks or risk treatments based on its probability and impact on a project. [2]
The aim of current article is to give an overview and summary of Risk Matrix. At the beginning, the article will provide briefly introduction to the risk management with its important elements. and the core idea of the risk matrices. Furthermore the article will defined the applications of presented tool as well as a practical usage within Project Management activities. Finally, the strengths and limitations of presented tool will determined and outlined.
Contents |
Introduction and main idea

Any projects during its different lifecycle stage are facing a variety of risks, defined as state of uncertainty where some possible outcomes have an negative effects on objectives, significant loss or other adverse or unwelcome circumstance.
Effective project manager need to be aware about potential types of risks in order to response and prevent unexpected event. This can be achieved by risk assessment process (shown in figure 1) which “aims to improve decision making process by identifying, assessing and mitigating relevant risks in a structured way” [3]. Each of these activities is very comprehensive and takes a huge amount of resources, money and time consumption. Thus, in order to balance cost, time and resource of particular project, the management have to prioritize risks instead of trying to address each and every risk that particular project might face.[4]
The one of the very useful risk assessment tool supports project management to decide which risk need to be consider at first called “Risk Matrix” or also known as “Probability and Impact Matrix”.
Risk Matrix (Probability and Impact Matrix) is a broadly used risk assessment tool to define the different levels of risk as the product of the harm probability categories and harm severity categories. [2]
The main aim of risk matrix is to classify and prioritize hazard of adverse events based on the level of risk in order to facilitate management to make decision whether certain risks can be admit or whether not. [5]
According to ISO 31000 [6]the definition of risk outlined as combination of two basis criteria:
- The consequences or the severity of the impact of an adverse event caused by the risk.
- The probability or likelihood that this event may occur
In its turn the level of risk or risk value is defined as multiplication of these two criteria
"Level of Risk=Probability x Consequence”[5]
The combination of these parameters created risk matrix as two-dimension grid with consequence/impact on one axis (commonly X-axis) and probability or likelihood on the other (Y-axis) as shown on figure 2.

The severity or consequences scale describes the range of different types of impact of the adverse events that, if it occurs, will have an effect on the objectives and/or values such as physical health, social status, emotional well-being or financial wealth [7]
The consequence scale are commonly extended from the lowest potential impact to the highest as illustrated in figure 02 and can comprise any number of criteria with nominal or textual description such as ““No impact”, “Minor”, “Medium”, or “C1”, “C2”, “C3” and etc.
The example of possible consequences criteria can defined as follows:
1. No impact: Limited hazard that will cause a near insignificant amount of harm to the overall progress of the project.
2. Minor impact: A minor hazard which lead to less significant extent of harm which in its turn not cause of a difference to the overall progress of the project are classified as minor risk.
3. Medium impact: Moderate hazard which do not imply a huge harm, though yet a considerable harm portrayed as medium.
4. Major impact: Critical risks with significantly large impact that may lead to a huge amount of loss or harm identified as major.
5. Extensive impact : The most adverse hazard that lead to a catastrophic consequences such as high amount of lives losses or harm that totally destroyed a project (for example tsunami) is outlined as extensive impact.
The other dimension of risk matrix is the likelihood scale describes the range of probability of the occurrence of a risk. As the consequence scale, the probability scale is also extended from the lowest potential likelihood to the highest as portrayed in figure 02 and comprised variety numbers of criteria with nominal or textual description such as ““High unlikely”, “Unlikely”, “Possible”, or “P1”, “P2”, “P3” and etc.
The example of possible probability criteria can outlines as follows:
1. Highly unlikely: Unlikely risks, which have a rare level occurrence such as less than 10%.
2. Unlikely: Seldom risk contains low probability of occurrence however cannot yet excluded entirely.
3. Possible: Hazard, which have occasional (50/50) likelihood of occurrence harm
4. Likely: Risks that lies among 60-80% chances of occurrence can be grouped as likely.
5. Very likely: A definite hazard that has highest frequency (generally more than 80 %) of reveal during certain project stages. [8]
The definition of both criteria consequence and probability scales could vary in different organization and project areas, thus it is worth mentioning that mentioned above descriptors is recommended as a guide only.
Finally, based on combination of probability and impact the level of risk can easily counted and ranked by placing adverse event into risk matrix according to assigned consequence and probability as shown on figure 3 [9]

As example the undesired event R25 displayed on the figure 3 has the highest risk value equal to “25”, or the risk R22 and R10 have the identical risk value ”10”.
Application and use
Application
Generally, the risk matrices have two main applications:
- - decision making regarding the acceptance of risk
- - prioritization which risk needs to be addressed first.[5]

Decision making regarding the acceptance of risk
In terms of risk acceptance, at least three levels of risk have to be isolated as illustrated in figure 04:
- The low probability, low severity area (Acceptable risk)
This area usually stressed with the green color and points ‘‘broadly acceptable’’ risk of an event. Hazards or events in which the risk is found is sufficiently controlled and not requiring further risk reduction
- An intermediate level of risk (ALARP)
This area often indicated with yellow color and display the level of risk that should be monitored, controlled and reduced ‘‘As Low As Reasonably Practicable’’ or ALARP[10] . Inherently the risk could accepted if management will decide to keep the risk at that level.
- The high probability, high consequences of risk (Unacceptable risk)
In this area risks are frequently indicated with a red color and determined hazards or events with unacceptable risk, i.e. events have to take comprehensive control measures in order to mitigate the risk. [9]
Prioritization which risk needs to be addressed first
In cases where the risk matrix is used for ranking, i.e. which hazard or event require most attention in order to mitigate cumulative risk, a larger number of risk levels may be necessary in order to obtain sufficient resolution to rank events or hazards in order of priority[5] as shown in figure 05

There is one important implication during the ranking of events with a very low probability, but an extensive severity and in contrary the events with highest probability and lowest impact. The user and designer of a risk matrix have to be aware about major risk aversion or major hazard aversion. Major risk aversion means that events with the lowest probability – highest severity should always assigned with higher priority than events with the highest probability and lowest severity, even the risk value for both events is the same. Those implication based on the nature of risk that originally includes aversion to the probability rather than consequence severity. [5]
Usage of Risk matrix
It is it is worth to mentioning the main aim of risk matrix: classification and prioritization the list with already identified risks in order to make decision whether the certain risks can be tolerated. Frequently, in some cases it may be enough merely to rank risks against each other to identify relative prioritisation [11]
In order to concretize how an application of risk matrix can be carried out, an illustrative example of risk matrix is provided below. The example is based on a case project regarding potential threats which may cause new entrepreneurs during launching new start-up related e-business(online sales). [12]
The entire process how to appropriate use the matrix can be determined with 5 steps: [4]
- Estimate the probability of each risk occurring, and assign it a rating as portrayed in table 1
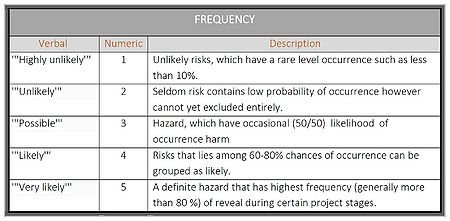 Table 1: Example of probability criteria table [8]
- Identify and assess the severity of the impact of an adverse event caused by the risk as illustrated in table 2.
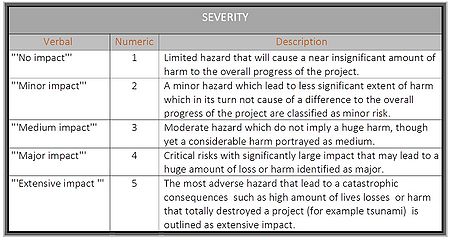 Table 2: Example of consequences criteria table . [8]
- Establish the list of risks with relevant consequence and probability as shown in table 3
-
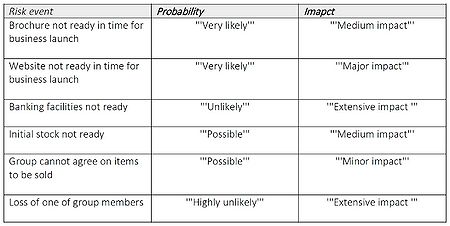 Table 3: Example of ranking risk [12]
-
- Explore and map list of risk on the Risk Matrix as shown in figure 6
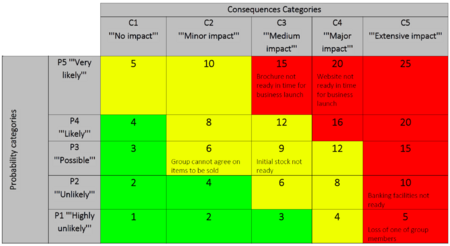 Figure 6: Risk Matrix with assigned risks
- Develop a response to each risk, according to its position in the chart. Remember, risks in the bottom left corner can often be ignored, while those in the top right corner need a great deal of time and attention
- Based both on the level of risk and color the user makes decision which certain risks must be addressed first. For example, in shown on the risk matrix above all ‘red’ risks need to be treated as high priority.


Limitations and strengths
Any tool or method has some notable weaknesses and strength. The Risk matrix is not an exception. Therefore both users and designers of risk matrices should be aware of these limitations and be ensure that the risk matrices are used correctly.
Strengths
- Easy to use;
Risk matrix is relatively easy to use and don’t require any additional knowledge [2]
- Quick method to visualize and categorize risks
Risk matrix provide a rapid ranking already defined risks into different significance levels, for example which risks need to be referred to a higher level of management [2]
Limitations
- It is difficult to combine or compare the level of risk for the different categories of consequences(impact)[2]
The different type of consequences such as the impact on the environment, human life, the economy or reputation cannot be used together as separate categories within a single risk matrix. These different impact do make it very difficult to compare two events with each other. For instance: An oil spill might have an impact on the environment and reputation, and also some asset and people impact. Which one is more severe? In order to prioritize risk each type of impact requires its own separate risk matrix.[9]
- Limited resolution
The typical risk matrices apply the discrete categories of impact and probability and therefore have not enough granularity in terms compatibility between numerical risk value and colors. Indeed insufficient resolution may lead to many numbers of risk value leading to the same color and vice versa as shown in figure 05. Therefore in order to prioritize risk the scales of risk matrix need to be set with larger number of categories, otherwise the risk matrix with limited resolution will only sufficient to address risk acceptance by using colors.[5]
- Subjective classification consequence and probability
Many organizations of risk matrix use a very tailor classification of consequence and probability that tend to be significant variation risk ratings. It based on the subjective human or societal aspects of risk perception such as individual experience, overconfidence or level of control, optimism bias, dread factor and etc.[3] Therefore before to use risk matrix the user have to be aware and ensure that explanations of embedded judgments express clear and unambiguously. One of the techniques to avoid the subjective perception is to use quantitative data as often as possible.[5]
- Major hazard averse
There are a drawbacks with events that have a very low frequency, but a very extensive severity. Often, risk matrices can mistakenly assign higher qualitative ratings to quantitatively smaller risks in terms of priority, and these types of events tend to ‘fall off’ the grid and get less attention than they deserve. The user and designer of a risk matrix have to be aware about major risk aversion or major hazard aversion. Major risk aversion means that events with the lowest probability – highest severity should always assigned with higher priority than events with the highest probability and lowest severity, even the risk value for both events is the same.[5]
Annotated bibliography
For further reading on the subject or related subjects, the reader is encouraged to check out the following:
- Nijs Jan Duijm (2015), Recommendation on the use and design of risk matrix, Safety Science 76, DTU, Denmark .[5]
- “The article explore the weakness of risk matrices and provide recommendation for the use and design of risk matrix
- Risk Management [1]
- The wiki-article describes the concept of the identification, assessment, and prioritization of risks followed by coordinated and economical application of resources to minimize, monitor, and control the probability and/or impact of unfortunate events or to maximize the realization of opportunities
- Risk Management - Risk assessment techniques, Dansk Standart DS/EN ISO 31010, 2010 [2]
- The international standard (ISO) 31010 contains guidance on selection and application of systematic techniques for risk assessment. .
- ALARP [10]
- “The wiki-article describes a term often used in the milieu of safety-critical and safety-involved systems.
Videos
A short video to visualyse the usage and benefits of Risk Matrix as explained in the article.
References
- ↑ 1.0 1.1 [Risk Management] https://en.wikipedia.org/wiki/Risk_management
- ↑ 2.0 2.1 2.2 2.3 2.4 2.5 2.6 [Risk Management - Risk assessment techniques] Dansk Standart DS/EN ISO 31010, 2010
- ↑ 3.0 3.1 [How to Do Projects”] “Joana Geraldi, Chrisitan Thuesen, Josef Oehmen, Textbook to 42433 - Advanced Engineering Project, Program and Portfolio Management course, DTU 2016
- ↑ 4.0 4.1 [Risk Impact/Probability Chart - Learning to Prioritize Risks ”] https://www.mindtools.com/pages/article/newPPM_78.htm
- ↑ 5.0 5.1 5.2 5.3 5.4 5.5 5.6 5.7 5.8 5.9 [Recommendation on the use and design of risk matrices'] Nijs Jan Duijm, Safety Science 76, p.21-31, DTU, 2015
- ↑ [Risk Management – Principles and Guidelines] Dansk Standart DS/EN ISO 31000, 2009
- ↑ [Risk Definition'] https://en.wikipedia.org/wiki/Risk
- ↑ 8.0 8.1 8.2 [A Critical Tool for Assessing Project Risk] http://www.brighthubpm.com/risk-management/88566-tool-for-assessing-project-risk/#imgn_0
- ↑ 9.0 9.1 9.2 9.3 [ Definition of the risk matrices] http://www.cgerisk.com/knowledge-base/risk-assessment/risk-matrices
- ↑ 10.0 10.1 [ Definition of ALARP method] https://en.wikipedia.org/wiki/ALARP ]]
- ↑ [ Whats-right-with-risk-matrices?”] “http://www.jakeman.com.au/media/whats-right-with-risk-matrices”
- ↑ 12.0 12.1 [Project Management”] “Maylor,Harvey. Project management, Fourth edition, Pearson 2010”