By Sonia Guerra Loji (s203379)
The article's aim is to highlight the usefulness of the Sankey diagram in a project & portfolio management context. The article includes a discussion of the diagram's pros and cons from the Managements perspective.
Abstract
Within project & portfolio management it has become even more important that leadership is able to visualize where resources are being allocated and used. This is in terms of simple supervision over the projects, but also to optimize the limited resources an organization has. The Sankey diagrams are a graphical way of visualizing the flow of resources in a team, project, process, company, etc. Resources mapped in a Sankey diagram can be anything from materials, monetary funds, people allocation, activities, etc.
Beginning in 1898, the Sankey diagram was first used by an Irish captain named Matthew Henry Phineas Riall Sankey. This first implementation of the diagram showed the energy efficiency of a steam engine.
[1] 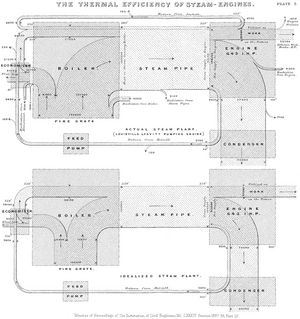
Captain Sankey's 1898 Steam engine diagram
[2] Now a days there are four main implementations of the Sankey diagram. First, to analyze flow, flow being whatever has movement (like resources) in the scope defined by the diagram. Second, to analyze time-based patterns, this type can visualize the behavioral change of a specific persona, group, thing, over a specific time-lapse. Third, to analyze hierarchy type data, this is used when there are connected relations between the data but a hierarchy between the data has been defined. This hierarchy defines the order in which the data will be split and mapped in the diagram. And finally, "quick trick" to replace Machine-learning, the Sankey diagram can be used to find and understand patterns in the data instead of using machine learning.
[3] All four applications of the Sankey diagram can produce valuable insights to data in a visual and straightforward way to understand.
Correct application and automation of the Sankey diagram can provide fast and easy access to complicated data. The purpose of the article is to dive further into the possible applications of the Sankey diagram, as well as the benefits it can bring to upper management when making decisions in terms of resources and strategy.
References
- ↑ |url=https://zenodo.org/record/2036163#.YggSQurMK3A
- ↑ |url=https://zenodo.org/record/2036163#.YggSQurMK3A
- ↑ |url=https://towardsdatascience.com/4-use-cases-for-sankey-charts-679b94f7c672

