Scheduling: Critical path, PERT, Gantt
Developed by Anne Dittmann
Contents |
Scheduling: Critical Path and PERT
Abstract
The success of a project execution is closely linked to the quality of the plan, the tracking and ultimately the predictability. It is therefore important to have a structured method and process for establishing the plan in order to get the best outcome and prepare the team if the unexpected happens. As a project manager it is therefore crucial to manage scheduling closely. A project schedule includes the projects milestones, deliverables and deadlines, etc. with duration estimate. The schedule is used for planning and to foresee when a project is estimated to finish. A critical path is a sequence of activities that determines the shortest possible duration of a project. To perform a critical path analysis several schedule models can be considered in order to structure the tasks of the project. One of the tools is Program Evaluation and Review Technique (PERT), which is a variation of and a complementary tool to the critical path analysis. The project manager can use this tool to analyze and represent the tasks to make sure that the project can be finished within the given time frame. The purpose of this article is to address the issues around scheduling and time management in a project by combining PERT with the critical path analysis.
Big Idea
Time management and scheduling is an essential mechanism in projects. A common used method in scheduling for project management is to apply network plan/activity analysis, where each task is taking into consideration with the individual dependencies and planned accordingly. [1] Activity network diagrams are a project schedule management tool that is necessary in order to define the critical path of the project.[2] Program evaluation and review technique (PERT) is an example of an activity network diagram tool. The purpose is to have a tool, which helps the project manager in managing the time given as effective as possible.
HISTORICAL BACKGROUND
The US Navy developed the management tool PERT in the 1950’s. It was developed with the purpose of assisting the Polaris Project and the idea was to develop a management tool to handle the contractors on the project. The Navy was worried about the threats from the Soviet Union and they wanted to deliver the project as quickly as possible. PERT was a part of the reason why Polaris finished ahead of schedule and on budget.[3] [4][5] Approximately at the same time as the PERT tool was developed, DuPont developed the Critical Path Method (history of….). It was created with the intention to handle similar challenges in a planning process of chemical plants. The critical path is a sequence of events in any projects that has a direct impact on the duration of the project. If any of these activities are delayed, it will delay the entire project. The tools PERT and critical path method/analysis are complementary tools since they both address the longest duration time of a project.
PROGRAM EVALUATION AND REVIEW TECHNIQUE DEFINITION
PERT is short for Program Evaluation and Review Technique. It is a scheduling tool for project management that shows how much time each activity/task of a project takes and thereby provides an estimate for the total amount of time needed to complete the project. The official definition from the PMI says: “A technique for estimating that applies a weighted average of optimistic, pessimistic, and most likely estimates when there is uncertainty with the individual activity estimates.” [6] The approach of the PERT tool combines the risks and uncertainties when estimating time of the activities. The technique takes the project and breaks it down into milestones and orders them in a network after their dependence of each other and duration. The longest path/sequence that connects all activities in the network is known as the Critical Path. The duration of the critical path is equal to the total duration of the project – if a delay occurs in one of the activities on the critical path, the entire project will be delayed as well. By this, it can be concluded that PERT is a variation of the critical path analysis. The Project Manager can use the tool to analyze time needed in order to complete the entire project and on individual basis with each activities including the dependencies.[7][8]
The technique estimates the duration of each activity by evaluating it with three estimates and determines the expected time used on the individual tasks. The three estimates to follow are: 1) Optimistic, 2) Pessimistic and 3) Most Likely. See the list below with a detailed description on each of the estimates.
Optimistic (denoted with tO): This estimate is the shortest possible time to finish each activity. It is the best case scenario for the activity regarding duration.
Pessimistic (denoted with tP): This estimate is the longest time it might take to finish each activity. It is the ‘worst case’ scenario for the activity regarding duration.
Most likely (denoted with tM): This estimate is the most likely length of time an activity will take. It is based on realistic expectations of the activity.
With the three estimates introduced, the expected duration (tE) can also be introduced as well. The name of the term speaks for itself; it is the estimate of the timeframe that is expected. The estimates described above leads to a formula that express the expected duration. It can be expressed as follows
tE = (tO + 4*tM + tP) / 6.
Application
This section will give you a stepwise and very thorough run-through on how to use and apply the PERT tool including a short introduction to critical path. First of all the method of the tool is described and afterwards an application example is identified to give an illustration of the tool in practice. The Critical Path Method and PERT is often used together, since they are complementary tools. They both address time management and each they have their individual strength that works perfect when combining. In practice the two tools has to follow certain steps in order to obtain the full outcome of the technique.
PERT DIAGRAM SPECIFICATIONS
The PERT tool is a precedence diagram, also known as ‘activity-on-arrow’ or network diagrams. This means that there are two main rules to follow, which is
1)All tasks are represented as arrows
2)The dates of the projects milestones are represented as nodes.
The annotation given above illustrated on Figure 1.
FRAME WORK OF PERT
This subsection provides a guide in how to apply and use the PERT tool. It is divided into 7 essential steps that together formulate the procedure of the tool.
Step 1
Define all tasks or activities of the project and the order of completion Some activities are dependent, which means they cannot begin until a predecessor activity is finished. While other activities can happen non-dependent.
Step 2
Define the 3 time estimates – Optimistic (tO), Pessimistic (tP) and Most likely (tM) - for each activity/task (in suitable quantities, e.g. days)
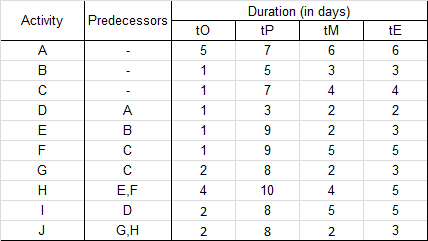
Step 3 Determine the expected duration (tE) of each task by using the formula tE = (tO + 4*tM + tP) / 6. It can be an advantage and very beneficial to use a table for the first three steps and combine them. An example is illustrated on the right
A ready to use table is to be found here[1]
Step 4
Draw and construct the network diagram which connects all the activities/tasks. As mentioned above the tasks are indicated by arrows and the milestones are indicated by nodes.
Step 5
Each activity can be assigned with the expected time (tE) as calculated earlier. These can with advantage be noted in the network diagram.
Step 6
Determine the length of the project.
This is done by calculating how long the project will take approximately. To get the longest time path of the project as possible, the critical path is defined. The critical path is the sequence (the path) that is the longest to run. For each path the total length of the project is calculated and the longest possible path can be determined from the calculations, simply by a glance. The critical path is then defined and is usually marked with red.
If all steps are followed, the PERT tool has been applied.
APPLICATION EXAMPLE
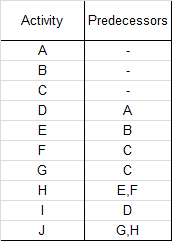
The following section will take the method described above and apply it to an example. It is based on the table found in Figure 2.
Step 1: Define all tasks of the project and put them in order
The tasks are defined in Figure 3 the to make it more manageable.
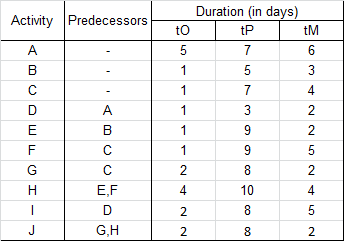
Step 2: Define the 3 time estimates for each activity.
The table above has been built upon and the time estimates for each activity has been added, which can be seen in Figure 4.
Step 3: Determine the estimated expected duration of each activity by using the formula tE = (tO + 4*tM + tP) / 6.
Lets take activity A as calculation example; tO = 5, tM = 6 and tP = 7.
tE = (5 + 4*6+7)/6 = 6
The rest is defined in Figure 5
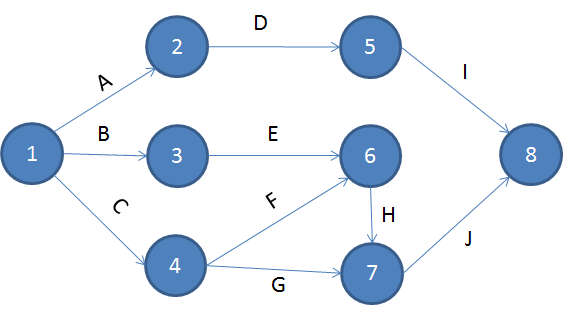
Step 4: Draw and construct the network diagram which connects all the activities/tasks.
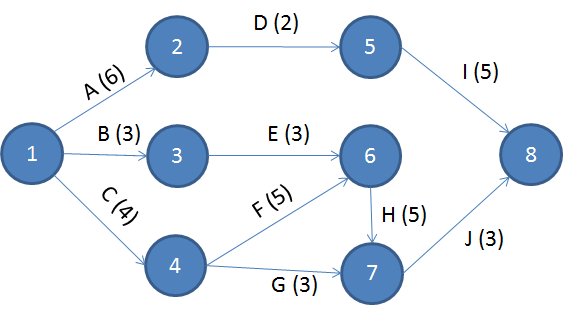
With the dependencies of this example of a project, it results in 8 milestones, which is defined as nodes in the network diagram. And each activity is defined as arrows. The network diagram will look as shown in Figure 6.
Step 5: Assign each activity with estimated expected time as calculated in step 3.
Each activity in the network diagram can now be assigned with the calculated tE. The updated network diagram can be seen in Figure 7.
Step 6: Determine the length of the project
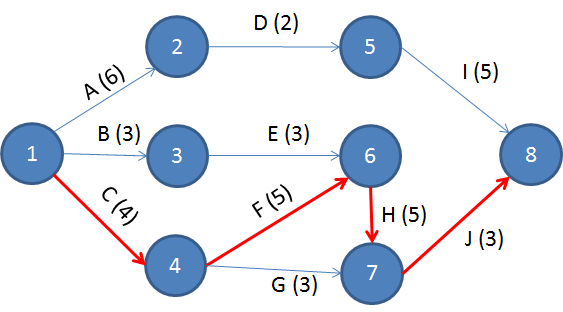
We take a look at each path in the network diagram individually. For each path the total length needs to be calculated. Let’s define each path and calculate the length of each path:
A -> D -> I = 6 + 2 + 5 = 13
B -> E -> H -> J = 3 + 3 + 5 + 3 = 14
C -> F -> H -> J = 4 + 5 + 5 + 3 = 17
C -> G -> J = 4 + 3 + 3 = 10
We clearly see that the path C -> F -> H -> J is the longest, since the duration is 17 days. We now have the critical path and the network diagram can be updated by marking the path with red as shown in Figure 8.
The PERT and CP tools has now been successfully applied to this project.
NOTE: There are several tools that support maintenance and easy update of the chart e.g. Microsoft Projects
[15]
Limitations
With every great tool comes pros, cons and limitations in general. When using the PERT tool, there are some limitations that the Project Manager should have in mind. Some of these limitations are described below. First of all, the PERT tool is a good scheduling tool, however it does not help the Project Manager to find the best and/or the shortest way possible to complete a project. [16] In addition to this, the tool is lacking the financial aspects. PERT has only focus on time and therefore it is limited in a way that it doesn’t always live up to the needs of cost, resources, etc. which is sufficient in order to fulfill the project. Finally, the PERT tool uses time estimates and the project manager is depending on dependable estimates from "the real world". The downside is that everybody knows that the world changes and quickly the information used in the tool, is outdated, which can lead to being potential unreliable. [17]
References
- ↑ Joana Geraldi et. al, How to DO projects. A Nordic flavour to managing projects, 2017.
- ↑ Project Management Institute, A Guide to the Project Management Body of Knowledge (PMBOK® Guide), 5th Edition, 2013.
- ↑ John Ryding Olsson et. al., Power in Projects, Programs and Portfolios, 2015.
- ↑ Archibald, R. D. (1987), "The history of modern project management. Key milestones in the early PERT/CPM/PDM days: how did we get here—where do we go?", Project Management Journal, 18(4), 29–31
- ↑ https://www.smartsheet.com/pert-101-charts-analysis-and-templates-more-accurate-project-time-estimates
- ↑ Project Management Institute, A Guide to the Project Management Body of Knowledge (PMBOK® Guide), 5th Edition, 2013.
- ↑ https://www.smartsheet.com/pert-101-charts-analysis-and-templates-more-accurate-project-time-estimates
- ↑ http://www.businessdictionary.com/definition/program-evaluation-and-review-technique-PERT.html
- ↑ Project Management Institute, A Guide to the Project Management Body of Knowledge (PMBOK® Guide), 5th Edition, 2013.
- ↑ John Ryding Olsson et. al., Power in Projects, Programs and Portfolios, 2015.
- ↑ https://www.youtube.com/watch?v=WrAf6zdteXI
- ↑ https://www.smartsheet.com/pert-101-charts-analysis-and-templates-more-accurate-project-time-estimates
- ↑ https://www.projectmanager.com/training/create-a-pert-chart
- ↑ Hillier&Lieberman, Introduction to Operation Research, 10th edition, 2015.
- ↑ https://support.office.com/en-us/article/use-a-pert-analysis-to-estimate-task-durations-864b5389-6ae2-40c6-aacc-0a6c6238e2eb
- ↑ http://www.businessdictionary.com/definition/program-evaluation-and-review-technique-PERT.html
- ↑ https://www.smartsheet.com/pert-101-charts-analysis-and-templates-more-accurate-project-time-estimates
Annotated Bibliography
“A Guide to the Project Management Body of Knowledge (PMBOK® Guide)”, Project Management Institute, 5th Edition, 2013. This book is a guide, that has the essential processes and tools of Project Management presented. The guide gives a good overview of scheduling in generel but contains only very limited information regarding the PERT tool.
“Introduction to Operation Research”, Hillier and Liberman, 10th edition, 2015 The tool PERT is basically operation research with its network diagrams. The book gives you the knowledge, you need to know, in order to perform a good PERT diagram.
“Power in Projects, Programs and Portfolios”, John Ryding Olsson, 2015 The aim of this book is to broaden your knowledge on the subject and other PM tools.
“PROGRAM EVALUATION AND REVIEW TECHNIQUE - Application in Education”, Cook, Desmonc L., 1966 This book contains a very thorough review of the PERT tool and its characteristics. It gives a good description on the implementation of the technique with focus on Educational research (good way of seeing the tool in use).
“Project Manager”, website, https://www.projectmanager.com/training/create-a-pert-chart This guide gives you the fundamentals, that the PMI standard and others cannot give you. The whole concept of the firm is to give you an easy understandable approach to simple Project Management tools.

