Talk:Forecasting and estimation techniques
Revision by Joakim Émile Cayouette
Update of "Forecasting and estimation techniques"
Forecasting and estimation techniques will be revised, and multiple sections will be re-written. Below are the bulletpoints of changes that are planned to be implemented. Please go to DRAFT REVISION to view the draft of the revised article, I have already revised all sections.
Thank you for reviewing my article revision, I am looking very much forward for your feedback! -Joakim
General improvements:
- References, a lot of information lacks annotations and references. This is crucial to the credibility of the article. Adding references would be a comprehensive task that would enhance the article's overall quality and credibility.
- Title: As the focus of the article is Forecasting, it should only state Forecasting. If other estimation techniques should be included, then internal references can be made to eg. Critical path method.
- More information on forecasting in relation to project management. Such as how it can be used for resource planning and budgeting, or how it can help to manage risks and schedule tasks. How is it different from other PM estimation techniques?
- Less focus on demand
- Develop figures that demonstrates the concepts
- Add structure
Abstract
- The very first sentence should briefly describe the term "forecasting". (DONE)
- Statistical methods, is not the right term as qualitative methods are also addressed in the article. This section will be re-written as it is unclear. (DONE)
- The last sentence is very long, it will be re-written. Also, include the PM perspective. (DONE)
- It should be more concise. (DONE)
Forecast approaches
- Title is misleading as it describes characteristic and not approaches. (DONE)
- This section should be "Big Idea" (DONE)
Demand classification
- Add structure and be more concise
- Visualizations to demonstrate concepts
- Does it only apply for demand? Maybe this fits better under quantitative methods. (DONE)
Forecasting classification
- Minor grammar mistakes (DONE)
- Title: classification -> time horizon (DONE)
- Missing references (DONE)
Forecasting methods
- Information on data requirements for each method. (DONE)
Qualitative methods
- Gramma mistake in 1st sentence. (DONE)
- Bad examples in 1st section. Make sure to mention expert judgement. (DONE)
- Highly complex? Not all of them. (DONE)
- Elaborate the methods (DONE)
- Last section should be moved up (DONE)
Quantitative methods (MAIN FOCUS WITH UPDATE)
- Very short and unclear. (DONE)
- Elaborate and demonstrate time series forecasting techniques (DONE)
- Elaborate state of the art techniques (DONE)
- Add equations and create visualizations if necessary (DONE)
- 1st sentence credibility concerns. I am not sure if the sentence is correct in all cases and there is no reference. (DONE)
- It should not be described specific to demand. (DONE)
Other... -> Limitations
- Once again, "demand" should be replaced.
- Once again, reference is missing.
- This should go under limitations
Global -> Forecasting process
- Title change to forecasting process (DONE)
- Move section up in the article, this is application (DONE)
- Add references (DONE)
- Separate 5 steps from 7 principles. (DONE)
Forecasting in project management(NEW)
- Write this chapter (DONE)
- Include reference to APPPM resources (DONE)
Problems -> Limitations
- Missing references (DONE)
- Information on how to adjust forecasts based on unexpected events.
- Title change: problems -> limitations (DONE)
- More focus on limitations (DONE)
Benefits
- There is currently a lot of repetition and it is a very long chapter. Some of the first sections in the chapter could be deleted.
- Wiki articles usually do not have a conclusion section (DONE)
Other Estimation techniques
- Add more internal estimation techniques
References
- Briefly summarize the key references
Comments
Please write your comments here:
DRAFT REVISION
Forecasting is the process of estimating future outcomes, such as demand, resource requirements, costs, and completion dates, based on past performance and current conditions. It is very common in any project or program that deviations occur on different scales between what is expected and reality. On many occasions, these deviations could have been reduced by analysing past experience and their respective forecasts[1]. Within the field of project management, forecasting is most often used to forecast cost, activity time, and quality. These are the ground pillars that define successful project management according to the iron triangle. Forecasting is found to be a significant factor, especially within supply chain management, for the effectiveness of strategic execution [2].
Throughout this paper, we will focus on the fundamental and state-of-the-art methods used in forecasting and on how organizations can optimize supply chains and management of projects through their use.
The term "forecast" can be associated with different fields, such as business, meteorological conditions, engineering, politics, and project management. In this article, the term forecasting will be approached from an operations management perspective.
Key perspectives: Complexity: Estimating, Uncertainty: Anticipating, Monitoring.
Big Idea
Depending on the discipline (business, economics, politics, industry, society, commerce...), the term "forecast" will have one meaning or another. At the level of operations management, forecasting is defined as an approximation to future circumstances through a subjective and objective assessment being different from past data, but taking them as a starting point. The goal of forecasting is to provide insights and support decision-making. Under no circumstances can forecasts be taken as if they were a "crystal ball" capable of seeing the future, since they will always have a percentage of error, depending on how the forecast has been made, as we will see below. This means that forecasts should always be accompanied by a measure of uncertainty [3].
Various forecasting techniques exists. The choice of technique depends on the characteristics of the data, the nature of the forecasting problem, and the desired level of accuracy. However, there are som key features that are common to all forecasts [4]:
1. Forecasts follows the assumption that patterns from the past will, to some extent, remain in the future.
2. Forecasts error is inevitable as forecasts cannot predict the future perfectly. Error should always be incorporated when forecasts are used in decision-making.
3. Forecasting accuracy decreases as the time horizon increases. In this case, uncertainty increases, and short-term forecasts are therefore often more accurate.
Time horizon
The forecasting process can be structured in different levels, which are defined according to the objectives and the time horizon (short, medium and long term). These must be carried out under a continuous improvement model, executed periodically and their performance should be measured, in order to keep improving the quality of forecasts.
Forecasts can be classified according to the time horizon covered[1]:
Short-term forecasts. The main applicability of short-term forecasts lay at the operational level. It can be used in scheduling tasks, assignment of workers or immediate material needs.
Medium-term forecasts. Medium-term forecasts are normally used to establish future resource needs. The goal is to make informed decisions regarding the purchase of raw materials, hiring of personnel, or acquisition of machinery and equipment.
Long-term forecasts. Long-term forecasts are used in strategic planning, as it helps inform decisions by considering market opportunities, external factors, and internal resources.
Forecasting process
The forecasting process can be described in the following 5 steps[4].
1. Define the objective: Once the objective of a forecast has been defined, a planning horizon and degree of accuracy must be set (long, medium or short term). For example, to plan the operations of a company dedicated to the manufacture of scooters, it will be necessary to forecast the company's global sales for the coming year, in order to be able to make a detailed plan for the supply of raw materials, production processes, necessary resources or management of logistics for delivery to the customer.
2. Collect data: The main source of data collection is collected and cleaned. The more data that can be collected, the more accurate the forecast will be. Outliers in data are identified and resolved.
3. Selecting forecasting technique: It is essential to to identify patterns in the collected data such as trend, points of maximum, seasonality, and cycles. In most cases it will be relevant to visualize the data to identify patterns.
4. Conduct the forecast: The forecast is conducted with the appropriate forecasting technique.
5. Validation: Forecast accuracy should be evaluated and monitored to conclude if the forecast is performing as intended. In the case that it is not, decisions on forecasting technique, validity of data, and assumption can be revised.
Forecasting methods
When deciding on a forecasting method there are two categories, qualitative and quantitative. The preferred approach depends on what data is available. If historical data consisting of numerical information is available, such as time series data, then quantitative methods that uses mathematical models to project historical data into the future are preferred. If there exists no historical data appropriate for quantitative forecasting qualitative methods that rely on judgement and intuition are preferred.
Qualitative methods
Qualitative methods allow for forecasting when there is no historical data or when such data is not relevant for forecasting. They are based on intuition and experience and often rely on expert judgement. The outcome of each method differentiates as they are contingent on the composition of participants involved, ranging from individuals who possess an intimate knowledge of the industry to those who possess the ability to provide insightful recommendations regarding future market demand. The main advantage of qualitative methods is that they consider intangible factors that are not considered in quantitative methods. For this reason, it is particularly useful when a company enters a new industry or launches a new product in the market[5].
Consumer surveys
Market research can be carried out with consumer surveys to determine the interest of customers or users of a product or service. Consumer surveys make it possible for organizations to sample consumer opinions that may otherwise be difficult to obtain. This technique requires a larger amount of ressources as surveys requires sufficient sample size as well as skillful design, administration, and interpretation[4].
Group consensus
The opinion of market experts, company insiders or industry executives is sought. Thanks to the experience of these people, who have a relatively accurate perception of market trends and the impact of possible changes, the company in question will be able to obtain fairly accurate data for its planning.
Delphi method
This method consists of obtaining the opinion of a group of anonymous experts through a list of questions about the industry and its market. The method is as follows[6]:
1. A series of questions about the desired industry and market is sent out.
2. Once the experts have responded, a report is compiled compiling the answers and their respective arguments.
3. The same report is sent to the respondents so that they can jointly adjust or modify their opinion based on the views of the others.
4. The process is repeated until the group of experts reaches a common agreement.
Salespersons' composite
Each salesperson makes an approximation of expected sales over a specific period of time in the region in which he/she is engaged, which will then be reviewed for validation. This technique is characterised as highly judgemental and it is the forecasters responsibility to combine all estimations into an overall company forecast[7].
Quantitative methods
Quantitative methods assume that the numerical information on historical data can be used to forecast the future. Once systems are in place that allow for the collection and analysis of data, quantitative forecasting techniques are less expensive, quicker to use, and appear to be more "objective" than qualitative methods. Forecasting models utilize time series data to make predictions about future outcomes. As such, quantitative forecasting techniques encompass a variety of statistical, mathematical, algorithmic, and optimization methods, including neural networks. These techniques rely on mathematical and statistical models to analyze past data and generate predictions about future patterns. The use of each technique depends directly on the availability of historical data[8].
Data pattern classification

Before deciding on which quantitative forecasting technique to use on time series data, it is essential to identify patterns in the data[4].
Trend is defined as a constant or systematic increase or decrease in demand as time progresses. An example of trending demand could be the sale of electric cars, whose demand has increased day by day for longer period[9].
Seasonality defines variations in data that occur according to a time of day, week, month or year. An example of seasonal demand could be the sale of ice cream during summer periods or the increase in demand for bouquets of flowers on Valentine's Day.
Cycles refers to wave-like patterns which strechtes longer period of times, longer than a year. Cycles are often used to describe patterns in economic and political context.
Irregular variations, often defined as outliers, are unusual circumstances which do not reflect the typical behaviour. These variations are therefore often identified and removed when cleaning the data and preparing it for a forecast.
Random variations refers to the residual variations in data after having accounted for all explainable behaviours, such as irregular variations.
Naive forecasting technique
Naive forecasts are a simple and inexpensive way of forecasting based on single previous values of time series data. If a company sold five units last week, the naive forecast would predict that five units will be sold during the current week. The naive approach can also be modified to incorporate a trend or seasonality when forecasting. An example of trend can be made if the company had sold four units two weeks ago, then the positive trend will indicate that six units will be sold during the current week. If seasonality is present, the forecaster can use data from the previous equivalent season to predict the current season[4].
Averaging techniques

Time series data often contain random variation which in many cases creates unnecessary noise. On way of eliminating noise is by averaging. By averaging, individual highs and lows will offset each other and create a smoother representation. Averaging will not reflect small changes but are intended to represent larger movements.
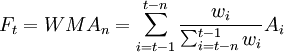
Moving Average
Moving average is the simplest way of averaging time series data. The moving average uses a specified number n of previous data points to forecast the value of the next data point. n is decided by the foreacastor according to the decided time horizon.

 Forecast in t period.
 Moving average with n periods.
 Value in t-i period.
 Amount of data points decided to be included in MA.
Whenever a new datapoint is registered, the recent data point will enter in the calculation of the moving average while the oldest one leaves, thereby updating the forecasted value.
Weighted Moving Average
It is common to assign larger weights to more recent data points when averaging to increase the influence of recent fluctuations. This is done by assigning weights in decreasing order from the most recent data point. It is up to the forecaster to decide the weight distribution as well as the n number of data points included[10].
 Weights decided by forecaster.
The summed value of the weights should be equal 1.
Single Exponential Smoothing
Exponential smoothing considers all datapoints and weights them exponentially increasing towards the most recent datapoint. Single exponential smoothing is used when there is not identified to be either a trend or seasonality behaviour in the time series data. In other words, single exponential smoothing is used when the data is stationary[10].

 Smoothing constant.
A smoothing constant  is introduced and it is up to the forecaster to decide the value. is often closer to 0 than 1 as this will put more weight one the previous forecast and thereby result in a more smooth representation. A single exponential smoothing forecast can be initiated by setting
  .
.
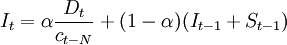
Double Exponential Smoothing
If a trend is present, one can use the double exponential smoothing technique for a more accurate forecast.
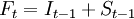
 Estimation of base in period t-1.
 Estimation of trend in period t-1.
The base and trend require two data points to initialize. They can be initialized the following way:
 ,
, 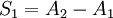 .
.
Then, the slope and the base can be calculated:


 Trend smoothing constant
Note that in addition to the smoothing constant, a trend constant \beta has been added. The value of \beta determines the weight of the most recent trend in the forecast. This technique is also known as Holt's method[11].
Triple exponential smoothing
If both seasonality and trend is present in the data, then triple exponential smoothing is a viable option. This technique introduces a seasonality smoothing coefficient. This technique requires at least two entire seasons of data to be initialized[10].
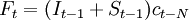
 Seasonal factor.
 Period duration.
The slope is commonly initialized as:

The initial seasonal factors are initialized:
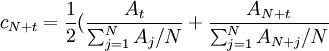
This leads to initialization of the base signal:

Now the estimations for base, trend and seasonality factors can be made.
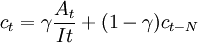
 Seasonality smoothing constant.
Note that a new smoothing constant is presented. A larger value of is chosen to put more weight on recent seasonality, making it more sensitive to recent changes. This technique is also known as the Holt–Winters method[12].
Other quantitative forecasting techniques
Regression Analysis is a statistical technique used to forecast future values based on past data. This method works by establishing the relationship between two or more variables [10]. Regression analysis is widely used in project management for predicting the outcomes of future projects.
Neural Networks are a type of artificial intelligence that can be used to generate predictions. This technique is useful in projects that require decision-making based on complex data [13]. Neural networks are capable of learning from a variety of inputs and can be used to generate forecasts with a high degree of accuracy.
Monte Carlo Simulation forecasts future outcomes based on probability distributions. The technique uses random sampling to generate multiple outcomes of a process, which can then be used to identify potential outcomes and develop strategies for managing the project [14]. Monte Carlo Simulation of Risk is often used in project management to identify potential risks and develop strategies for mitigating them.
Forecasting in project management
Forecasting is important for a project manager as it helps to uncover future trends and insights. Forecasts can give a better understanding of the environment in which a project operates. From a system oriented problem solving perspective, forecasting methods are highly relevant when predicting the behavior of the environment as part of a situational analysis [15]. In this context, forecasting is an essential tool to project managers when conducting analysis of the future state. Project managers are able to forecast a behavior and assess whether the forecasted outcome poses a threat or opportunity. For example, forecasts may indicate an increase in the expected completion time of a deliverable, which may indicate a weakness of the entire project. The project manager then has to take action to change course in response to this forecast to minimize the risk of delay in delivery. Forecasting can also be used to address opportunities and threats. For example, forecasts of customer demand can be used to determine whether new markets are emerging, and managers can determine whether new business opportunities or threats to existing market activities are present. Forecasting can therefore be a useful tool when conducting a SWOT Analysis or portfolio analysis.
Within quantitative forecasting, project managers can use data from a variety of sources. Data can be taken from sales, budget, activity duration or even customer reviews. Even stakeholder satisfaction can be forecasted: A study on large-scale projects (Turner, R (2012)) [16] suggests that if well defined performance indicators are developed, stakeholder satisfaction can be measured and thereafter forecasted with quantitative forecasting techniques. The forecast can then indicate how stakeholders will perceive success months or years into a project. This is valuable information to project managers as they can use it in proactive decision-making of stakeholder relations. In general, if the required data can be obtained, quantitative forecasting techniques can be used to support proactive decision-making for project managers.
As qualitative forecasting is based on less tangible information, the information can come from sources such as interviews, observations, and focus groups. Qualitative techniques can help project managers better understand the dynamics of their projects and how likely it is to meet their goals. For example, qualitative techniques can be used to forecast the estimated completion date of a project by allowing experts to make estimations based on their knowledge and the situation they observe. The Delphi Technique in Project Management can be used in this case to gather expert estimates when formulating a complete company estimate.
For a forecast performed by project managers to be successful, it is important to clearly plan the scope of the forecast and closely communicate with stakeholders to assure that project timeline, budget, objective and expected outcomes are considered when planning the forecast. Although forecasting can be carried out by one person, decision-making larger organizations often relies on collaboration with upper management. By collaborating, upper management can gain a better understanding of the forecast developed by the project manager and thereby be better prepared when making informed decisions about the project. The study conducted by Turner et al [16] indicates that including stakeholders when deciding and defining performance indicators when carrying out the forecast will increase its success. This demonstrates the importance in collaboration and clear communication with stakeholders when forecasting.
Limitations
Despite the usefulness, forecasting is not a perfect tool and cannot provide an exact prediction of the future due to various unpredictable factors. Each Forecasting technique has its limitations and specific use cases. Here only the limitations common to most forecasting techniques will be addressed.
Not everything can be forecasted when the level of information available and knowledge is not sufficient. For example, when predicting the lottery numbers for tomorrow a forecast will not have a higher accuracy than straight guess work. According to Hyndman, R.J., & Athanasopoulos, G. (2018)[1] three factors are central when anticipating the accuracy of a potential forecast, they state:
- how well we understand the factors that contribute to it;
- how much data is available;
- whether the forecasts can affect the thing we are trying to forecast.
In terms of predicting lottery numbers, there is simply no data available indicating a pattern as it is completely random. A more specific example that Hyndman, R.J., & Athanasopoulos, G. (2018) makes, is about predicting currency exchange rates. Currency exchange rate behaviour is an extraordinarily complex system, and the varying factors are difficult to understand. Furthermore, if exchange rate forecasts are made publicly available on the future value of the currency, the exchange will be self-fullfilling as the predicted value will become the current value, thereby affecting the thing we are trying to forecast.
Overfitting can occur. A forecast may be highly accurate when calculating the forecast error on a set of data, however, this is does not guarantee the same accuracy when predicting future values[1]. Overfitting is a term often used within the field of machine learning. Some factors that may increase the risk of overfitting include: Limited size of training set, classifier complexity and data outliers[17].
One-off periods of abnormal time series data. For example, in time windows, the demand for a product grows unexpectedly. This unusual demand phenomenon should be addressed in terms of its impact on future forecasts. For example, during the first Corona virus crisis, toilet paper demand peaks. The demand for this product was remarkably high but should not be confused with seasonal demand or trend when analysing the time-series. It showed that the market required larger quantities of toilet paper under the specific circumstances, a phenomenon that is in principle unlikely to occur again and difficult to predict.
Accuracy without historical data is low. For example, new products that are launched on the market do not have historical sales records or data to be used to make forecasts of how they will behave or how the market will adopt the inclusion of this new product. Therefore, there are two solutions to be taken by the person in charge. First, use historical records of a similar item or one that is expected to perform similarly. This data could be used as a reference to make initial forecasts. Secondly, there is the option of using standard release curves, i.e. if you assume that the product will have an exponential growth of a specific percentage or a trend increase of x%, this statistic can be used to make the first forecasts. It is important to emphasize that these first forecasts may differ more than usual with the real market behavior, but they can help the company to make a first planning.
Benefits
The objective of forecasting systems is to provide information about future changes and their impact. It is a task that today can take up an entire department or even the possibility of having only one person responsible within the organization.
As addressed in this article, there are multiple approaches to forecasting, from advanced mathematical/statistical methods to subjective judgement.
Nowadays, the forecasts are often made using advanced quantitative methods by means of specialized software, of which there are dozens on the market. The forecasts obtained are reviewed by related members of the entire organization (sales, project managers, senior management, or engineers) who must validate or correct them.
Forecasts have a great value in terms of advanced project management, since, as mentioned above, they allow the company to obtain a vision of the future in advance, helping the organization to position itself for the future and to be able to make the relevant decisions.
To be more specific, let's take the example of a company that builds cars and decides to make a sales forecast with a time horizon for the next three years. Let's see how this affects the company's organization:
Firstly, the human resources level, as the company has to coordinate to manufacture a specific number of cars per day, it will be able to manage the number of employees it needs at any given time and their work shifts to service the expected demand, avoiding overstaffing or understaffing costs.
Secondly, at supply chain level, the company could reach agreements with its suppliers to reduce costs thanks to the loyalty or recurrence of their orders, as well as plan the expected use of raw materials and thus optimize their use, saving large amounts of money.
At the logistics level, the company will be able to optimize its inventories and warehouses, since by knowing the quantities to be manufactured at any given time, it will be able to have only the necessary parts in stock. In this way, the company would save costs of parts permanence, since keeping meaningless units in the warehouse is a fixed cost that must be taken into account, and on the other hand, in the case of perishable products, the company would avoid the cost of discarding them, since it would only have the necessary products at the necessary time.
Finally, at the economic level, in addition to avoiding costs at the human resources, supply chain and operational levels, the company, by being able to foresee how much it will have to invest, will be able to manage its economic resources efficiently. That is to say, it will know when to keep its capital in cash or when it can afford a large outlay (to increase capacity, expand its facilities, invest in research and development...).
Other Estimation techniques
Annotated references
Hyndman, R.J., & Athanasopoulos, G. (2018) Forecasting: principles and practice, 2nd edition, OTexts: Melbourne, Australia. OTexts.com/fpp2. Accessed on 11-02-2023. The book contains a comprehensive introduction to both the fundamental forecasting techniques as well as moderne´state-of-the-art forecasting techniques. The book is mainly intended for undergraduate students, MBA students, and people in companies that can benefit from forecasting. It is actively used in teaching at Monash University, Australia.
Stevenson, William J., et al. Operations management. Boston: McMcGraw-Hill Irwin, 2007. Book on operations management, chapter 3 includes an introduction to forecasting. The chapter goes into fundamental forecasting techniques, both quantitative and qualitative. It focuses on demand forecasting.
Snyder, L. V., & Shen, Z. J. M. (2019). Fundamentals of supply chain theory. John Wiley & Sons. Book on supply chain theory. Most of the quantitative forecasting techniques in this article are further described in Chapter 2 FORECASTING AND DEMAND MODELING.
Turner, R., & Zolin, R. (2012). Forecasting success on large projects: developing reliable scales to predict multiple perspectives by multiple stakeholders over multiple time frames. Project management journal, 43(5), 87-99. Paper on developing performance indicators measuring stakeholders' perception of success in large scale projects to enable forecasting. A model to do so is developed and described in the paper.
References
- ↑ 1.0 1.1 1.2 1.3 Hyndman, R.J., & Athanasopoulos, G. (2018) Forecasting: principles and practice, 2nd edition, OTexts: Melbourne, Australia. OTexts.com/fpp2. Accessed on 11-02-2023.
- ↑ Smith, A. D., & Offodile, O. F. (2007) Exploring forecasting and project management characteristics of supply chain management. International Journal of Logistics Systems and Management, 3(2), 174-214.
- ↑ Mamun, Ziaul Haq., et al. (2005) Operations Management, School of Business Bangladesh Open University.
- ↑ 4.0 4.1 4.2 4.3 4.4 Stevenson, William J., et al. Operations management. Boston: McMcGraw-Hill Irwin, 2007
- ↑ García-Díaz, A., Smith, J. MacGregor., (2014) Facilities Planning and Design.
- ↑ Sniezek, J. A. (1989). An examination of group process in judgmental forecasting. International Journal of Forecasting, 5(2), 171-178.
- ↑ Peterson, R. T. (1993). Improving sales force composite: forecasting by using scripts. The Journal of Business Forecasting, 12(3), 10.
- ↑ Montgomery, D., Jennings, C., Kulahci, M., (2008) Introduction to Time Series Analysis and Forecasting.
- ↑ Link, C., Raich, U., Sammer, G., & Stark, J. (2012). Modeling demand for electric cars-a methodical approach. Procedia-Social and Behavioral Sciences, 48, 1958-1970.
- ↑ 10.0 10.1 10.2 10.3 Snyder, L. V., & Shen, Z. J. M. (2019). Fundamentals of supply chain theory. John Wiley & Sons.
- ↑ Holt, C. C. (1957). Forecasting seasonals and trends by exponentially weighted moving averages, Office of Naval Research. Research memorandum, 52.
- ↑ Winters, P. R. (1960). Forecasting sales by exponentially weighted moving averages. Management science, 6(3), 324-342.
- ↑ Remus, W., & O’Connor, M. (2001). Neural networks for time-series forecasting. Principles of forecasting: a handbook for researchers and practitioners, 245-256.
- ↑ Fenton, N., & Neil, M. (2018). Risk assessment and decision analysis with Bayesian networks. Crc Press
- ↑ Züst, R., & Troxler, P. (2006). No more muddling through. Springer, Dordrecht. doi, 10, 978-1.
- ↑ 16.0 16.1 Turner, R., & Zolin, R. (2012). Forecasting success on large projects: developing reliable scales to predict multiple perspectives by multiple stakeholders over multiple time frames. Project management journal, 43(5), 87-99
- ↑ Ying, X. (2019, February). An overview of overfitting and its solutions. In Journal of physics: Conference series (Vol. 1168, p. 022022). IOP Publishing.