Work in progress!!! This article will contain a reporting on relevant tools related to case work conducted together with Ørsted.
And remember boyzzz, we draw all the figures ourself. If you are not good at it, draw a draft and it will be revised.
Group members
| Erik Arvid
|
Hosszu
|
s200154
|
| Jacob
|
Clemmensen
|
s144069
|
| Björgvin
|
Hjartarson
|
s154659
|
| Breno
|
Strüssmann
|
s193580
|
| Tobias
|
Thyssen
|
s143786
|
| Hashim
|
Harmeed
|
s193272
|
Introduction
Tools
Introduce the tools chosen and why they were chosen (importance).
Also relevance to the specific case
Tool 1 - SWOT
SWOT is a framework model used for identifying and analyzing the strength, weakness, opportunities and threats within a company. 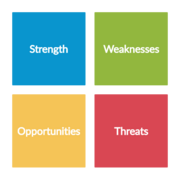
Figure 1: SWOT model - Made by TeamSted
- Strength: The first element highlights the strength within a company and investigates how they distinguish from competitors.
- Weakness: The second element highlights the weakness within a company, and critically investigates what other companies do better.
- Opportunities: The third element highlights the opportunities within a company, and looks into the company development of new ideas that lead to new markets
- Threats: The fourth element highlights the threats within a company, and investigates what may affect the success and growth of a company
Generally, SWOT is an efficient and valuable tool to gain insight into, what is realistic to achieve and where the focus area should be. The managers within a company can easily identify and evaluate if their goals are achievable and if they are not, then the SWOT model can be modified by going through each of the four elements.
Tool 2 - Stakeholder Mapping
Written by Björgvin
Definition
Stakeholder mapping is a visual representation of stakeholders in a system. This can be done in a variety of ways depending on the purpose of the mapping, most often focusing on defining relationships within the system (Direction of incluence(PMI)) or characteristics of the stakeholders (as with the….).
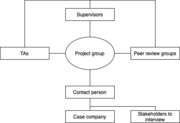
Figure x: Stakeholder map: example of a visual representation of stakeholder relations - Made by TeamSted
Practical guidelines /how to
This description focuses on general stakeholder identification and grouping and mapping relationships. See xxx for…….
When mapping, can both individual stakeholders and stakeholder groups be included to the level of detail relevant.
“Identify Stakeholders is the process of identifying project stakeholders regularly and analyzing and documenting relevant information regarding their interests, involvement, interdependencies, influence, and potential impact on project success.” (PMI)
Individuals and groups
Internal and external
Benefits and limitations
Stakeholder mapping provides “..highly visual representations of complex situations, (Walker et al.) that creates and overview and consensus about e.g. the boundries of the system or insights into stakeholder caracteristics or relations. The map is however only provides a view within the set scope,,,,, something about needing to be continually updated in many cases as ecosystems change.
Tool 3 - Power influence stakeholder grid
Power influence stakeholder grid is a crucial aspect of the stakeholder management. 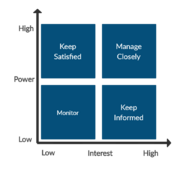
Figure 2: Power Influence Grid - Made by TeamSted
The first step in a power influence grid is to find the key stakeholders related to a project and identifying the individuals that have interest in the outcome of the project. The second step is to prioritize/identify the stakeholders. The manager must map or classify them in relation to engagement level of the project. The mapping process is divided into the level of interest and level of influence. The level of interest refers to stakeholders that are affected by the project outcome, but they have no power to influence project requirements. The level of influence refers to stakeholders that have power in setting and modifying project requirements. The third and last step is understand the key stakeholders. It is important to understand how the stakeholders feel with the project, and figure out how to engage and communicate with them.
Tool 3 - Bubble diagram
The Bubble diagram is a multipurpose visual decision-making tool used in project portfolio management. 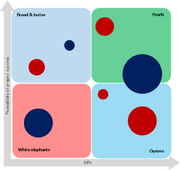
Figure 3: Risk\Reward bubble diagram - Made by TeamSted
The diagram originates in a standard x-y plot were circles are used to indicate a given entry. Where a bubble diagram differentiates from similar diagrams is in the information stored in the diagram. Two extra dimensions can be added to the plot in color-coding of the entire and the size of the circles.
The most common type of bubble chart is a Risk-Reward chart showing the Net Present Value(NPV) relative to the probability of success of a given project.
This is also the type that is used to showcase a bubble diagram as seen in figure XX.
Here the urgency of the project is quantified in a color code where red marks the most urgent projects.
The size of the circle indicates the extent of the project, this can contain several elements dependent on the project type i.e information needed or the number of estimated work hours.
The Risk-Reward chart maps projects into four distinct categories to help the portfolio manager make a decision based on the individual projects' business profitability. The four categories are the four quadrants of the diagram, each is named after how the manager should relate to them:
- Bread and Butter: The Projects located in the upper left quadrant falls into this category. They are low-risk projects but there projected outcome is also low therefor they are a safe investment.
- Pearls: If a project falls in the upper right quadrant they are called Pearls these projects have high profitability of success and have potential large rewards. These are the projects that a business should aspire towards.
- White Elephants White Elephants are located in the lower-left corner these projects are high-risk low reward projects. These projects should be avoided.
- Oysters All projects in the lower right quadrant holds the potential of becoming a star project do to a potential high NPV, but they come with a low probability of success. These projects are often innovative new projects and therefore should be considered by the decision-maker.
The bubble diagram is a versatile tool that can be used as a relatively prompt way to base a decision on.
Tool 4 - Competency mapping
Written by Björgvin
Definition
Yuvaraj defines competency mapping as “a process of identifying key competencies for an organization, the jobs and functions within it.” And further highlights that it helps individuals and organisations understand themselves by showing them where to direct career development efforts based on the identified strength and weaknesses. It is recommended to use competency mapping to address the two following questions (Seema)
- What skills, knowledge and characteristics are required to do the job?
- What behaviour has the most direct impact on performance and success in the job?
Competancies can be grouped under the following (Naqvi)
- Technical or functional: Associated with the technical or functional expertise required to perform the specific role.
- Managerial: Knowledge, attitude and skills required to plan, organize and mobilize various resources.
- Human: Knowledge, attitude and skills required to motivate, utilize and develop human resources.
- Conceptual: The ability to visualize the invisible and think at abstract levels.
And specified as one of the following types of characteristics, where the latter are easier to develop (Seema)
- Motives—The things a person consistently thinks about or wants and that which causes action. Motives ‘drive, direct or select’ behaviour towards certain actions or goals and away from others.
- Traits—Physical characteristics and consistent responses to situations or information.
- Self-concept—A person’s attitudes, values or self-image.
- Knowledge—Information a person has in specific content areas.
- Skill—The ability to perform a certain physical or mental task.
Practical guidelines /how to
Many frameworks have been proposed for competency mapping focusing on different aspects where Yuvaraj 2011 suggests the following approach for identifying competencies for organization and a job within a function
- Identify the department for mapping.
- Identify the Structure of the organization and select the grades & levels.
- Job Description from individuals and departments.
- Conducting Semi-Structured interviews.
- Collecting interview data’s.
- Classify the required Skill list.
- Identify the skill levels.
- Evaluate identified competencies and skill levels with immediate superiors and other heads of concerned departments.
- Preparation of Competency calendar.
- Mapping of Competencies.
Where they can be more specificly mapped within e.g. The Personal Competency Framework which consists of 45 competencies under six main headings (intellectual, personal, communication, interpersonal, leadership, result oriented) where performance is evaluated on a scale from 0-5 and importance on a scale from 1-5
Benefits and limitations
Competency mapping provides a frame for matching expectations between businesses and employees and overview of how things are and what has to be done. The limitations of competency mapping lay in the lack of guidance on how to act on those insights (Yuvaraj 2011).
Tool 5 - RACI Chart
Definition

Figure 5: RACI Chart - Made by TeamSted
The RACI chart is a matrix based chart. It clarifies the roles and responsibilities of team members for individual tasks. RAM (
responsibility assignment matrix) is an adaptable chart, that can at higher levels serve as a summary of work assigned to a particular group. More straightforward a matrix based chart is used when roles, responsibilities and levels of authority among team members are to be specified. The RACI chart uses responsible, accountable, consult and inform statuses to define the involvement of stakeholders in project activities. A RACI has a great utilization when roles and responsibilities need to be described unambiguously. For example when team members are from different departments or organizations.
Practical guidelines /how to
The meaning of the letters:
- R = (Responsible): Who is completing the task.
- A = (Accountable): Who is making decisions and taking actions on the task(s).
- C = (Consulted): Who will be communicated with regarding decisions and tasks.
- I = (Informed): Who will be updated on decisions and actions during the project.
Benefits and limitations
Tool 6 - Porter's Five Forces of Competitive Position Analysis
Definition
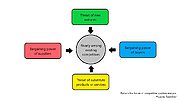
Figure 5: RACI Chart - Made by TeamSted
Porter's Five Forces of Competitive Position Analysis were developed in 1979 by Michael E Porter of Harvard Business School as a simple framework for assessing and evaluating the competitive strength and position of a business organization.
This theory is based on the concept that there are five forces that determine the competitive intensity and attractiveness of a market. Porter’s five forces help to identify where power lies in a business situation. This is useful both in understanding the strength of an organization's current competitive position, and the strength of a position that an organization may look to move into.
Strategic analysts often use Porter’s five forces to understand whether new products or services are potentially profitable. By understanding where power lies, the theory can also be used to identify areas of strength, to improve weaknesses and to avoid mistakes.
Practical guidelines /how to
The five forces are:
- 1. Supplier power: An assessment of how easy it is for suppliers to drive up prices. This is driven by the: number of suppliers of each essential input; uniqueness of their product or service; relative size and strength of the supplier; and cost of switching from one supplier to another.
- 2. Buyer power: An assessment of how easy it is for buyers to drive prices down. This is driven by the: number of buyers in the market; importance of each individual buyer to the organisation; and cost to the buyer of switching from one supplier to another. If a business has just a few powerful buyers, they are often able to dictate terms.
- 3. Competitive rivalry: The main driver is the number and capability of competitors in the market. Many competitors, offering undifferentiated products and services, will reduce market attractiveness.
- 4. Threat of substitution: Where close substitute products exist in a market, it increases the likelihood of customers switching to alternatives in response to price increases. This reduces both the power of suppliers and the attractiveness of the market.
- 5. Threat of new entry: Profitable markets attract new entrants, which erodes profitability. Unless incumbents have strong and durable barriers to entry, for example, patents, economies of scale, capital requirements or government policies, then profitability will decline to a competitive rate.
Arguably, regulation, taxation and trade policies make government a sixth force for many industries.
Benefits and limitations
Five forces analysis helps organizations to understand the factors affecting profitability in a specific industry, and can help to inform decisions relating to: whether to enter a specific industry; whether to increase capacity in a specific industry; and developing competitive strategies.
Tool 7 - Roadmapping in Program Management
Definition
Technology roadmapping refers to the process of visual planning on multiple layers such as: Marketing, product or development. By compiling a time-based chart, alignment of previous layers can be achieved towards one integrated planning approach.
If done successfully, roadmapping in program management can be a powerful tool to carefully analyse and define the need for initiatives and programs and their design, but also to administer the programs and their underlying activities.
The method of technology roadmaps were first recognized in the 1970s in use by Motorola in an effort to integrate their technology and product development/planning. Since then, many different variations and versions of the roadmap has been developed for different purposes like service/capability and knowledge assets. However, all types of roadmaps share the common approach of forecasting the effects of certains elements into future or past goals.
Practical guidelines /how to
Roadmaps can be applied in different phases of program management. It can be used to design a program from scratch or it can be used to review and/or improve an existing program. In the following, the method for designing a roadmaps from scratch is described but if the map is used to review/improve, some steps can just be skipped depending on the situation.
The general approach is to; ask key questions, get key input, map key activity and forecast key output.
- Key questions: How will basis-elements shape the future development of the higher layers? or which elements on the lower levels are required to comply with the next higher layers' requirements?
- Key input: Identify current technology, competency, or project portfolio as the base-layer of the roadmap and set strategic goal(s) to pursue development in a specific direction.
- Key activity: Estimating future trends and possibilities, finding logical developments and strategically aligned uses of resources available right now. Also deriving necessary activities, projects and elements to attain a goal, considering the risk or influence of different scenarios.
- Key output: For example a realization that the company holds unnecessary or undesired assets of competencies/projects that cannot be utilized in the future. If read as backcasting the output could also be a streamlined project portfolio that links the different initiatives logically towards a specific strategic goal
Benefits and limitations
As previously mentioned in the definition, the key benefit of roadmapping in program management is coordination and alignment. A well executed roadmap offers a high-level scope and focus on interdependencies which serve as an enabler for guaranteeing fit between the programs elements. However, roadmaps also improve program management in more ways such as: Improving commitment, avoiding mistakes of gaps in programs, providing a common direction/focus, stakeholder management, benefit/value creation, risk management, improve collaboration, improve decision making, clarification of responsibilities.
Tool 8
Definition
Practical guidelines /how to
Benefits and limitations
Tool 9
Definition
Practical guidelines /how to
Benefits and limitations
Tool 10 - BCG Matrix
Definition
The BCG Matrix (Boston Consultant Group) is a world wide known tool that is manly applied for consideration of products, however it can also be used as a tool when trying to visualize a company`s project portfolio. The matrix consists of 4 quadrants, each of those represent a state the project is currently in. Therefore a skeptical look must be applied. Different views from distinct people from all of the company`s departments should be considered in order to a well accurate Matrix to be created. The horizontal axis of the matrix correspond to the "Relative market share", and the vertical axis is the "Market growth rate" of the considered projects. An example of BCG Matrix can be seen on the figure, and as shown, the 4 different quadrants are defined as: "Question Marks", "Stars", "Cash Cows" and "Poor Dogs".
Practical guidelines /how to
To start a BCG Matrix a portfolio of projects must be defined. Then, the projects must be placed in the matrix according to their relative market share and the market growth rate. After the matrix has been structured the analyzes of its quadrants comes to action. If a project is placed in the "Cash Cows" quadrant it means that this is a very important project for the company and must be kept because it is from its revenue that the "Stars" and the "Question Marks" projects are being sustained from. However, if a project is placed in the "Poor Dogs" quadrant, a divestment on this project is highly recommended and it should be kept aside until it is cut from the company´s portfolio. The projects that are in the "Stars" quadrant have a robust power of growth and expansion, therefore they should be stimulated with investments in order for them to become "Cash Cows". In the other hand, a further analysis must be made regarding the projects that are found in the "Question Marks" quadrant, because two possible paths can be chosen for the projects future: invest resources on it so it becomes a "Star", or withdraw resources from it in order to have sufficient resources to other projects and it will consequently for the "Poor Dogs" quadrant and die. One important consideration related to the "Question Marks" quadrant is that not all projects can be selected to receive investment and become "Stars", a part of the projects must be disregard and left apart so that others can thrive.
Benefits and limitations
The benefit of the BCG Matrix is it´s relative simplicity to be understood. It´s visualization is also one advantage that permits rapid and clear interpretation once it is understood. Since it is made with only two axis, there are only two variables to be thought about. However, this is also a disadvantage, because projects have more variants than only relative market share and market growth rate. Another disadvantage to be considered is that in order for it to be made, different members from different departments must be present and agree while developing the matrix, otherwise it will not become a reliable matrix and decisions will further lead the company to failure. In addition, the placing of the projects considering the both axis is considered to have a high percentage of subjectivity, which is why the "BCG Matrix" is not considered as a common tool to be applied among the literature.
Conclusion
Annotated Bibliography
References


