Group members
| Patryk
|
Bijak
|
s192662
|
| Pawel
|
Grudziński
|
s192672
|
| Ertol
|
Zhurda
|
s190011
|
| Daniel
|
Bahrin
|
s190185
|
| Doth Angellina Pernille
|
Andreasen
|
s070167
|
| Antons
|
Osadcijs
|
s200769
|
==
Introduction
Apriside – company that owns OilfieldOS is looking for new markets and has identified huge potential in offshore wind farms logistics. Basing on several sources we believe that large amount of knowledge from offshore O&G industry can be transferred and used by offshore wind farms. Building on that assumption, OilfieldOS that is currently used in offshore O&G operations can be easily adapted to the new market.
Collection of Tools
Below we present collection of tools that can be helpful during work on our project.
Natural Planning Model
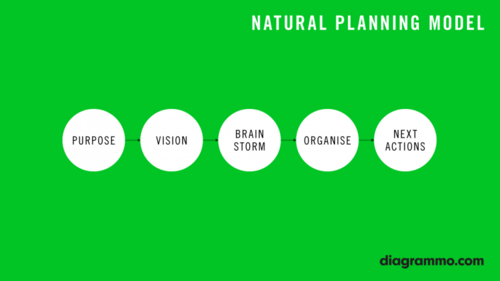
The Natural Planning Model is a 5-step procedure detailed by David Allen that aims to describe how our brain plans naturally. Allen defines a project as any outcome requiring more than one action step.
[1]
Here are the Natural Planning Model steps
1. Define Purpose and Principles
2. Envision the Outcome
3. Brainstorm
4. Organize
5. Identify the Next Actions
Natural Planning model
[2] The Four-Criteria Model
The Four-Criteria Model - At any given time of the day, you can use 4 criteria to decide what you should do from among the many things that you could possible work on. The four criteria are context, time available, energy available and priority, in that order. We think that we must work on the task with the highest priority but you are often constrained by the first three criteria. [3]
[4]
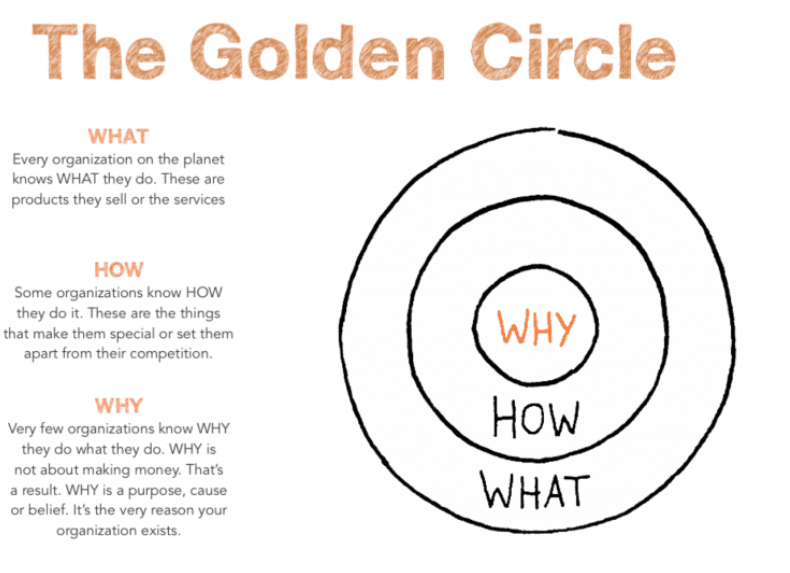
The Golden Cirkel. -why? -How? -what?
[3]
[4]
The Golden Cirkel. -why? -How? -what? Is a three step model that analyzes, first the purpose (-Why?), the process (-How?) and what is the result, the product, what does the companey produce (What?). In other ways; "Why do we do it? How do we do it? and what is the result? -the product? ect.
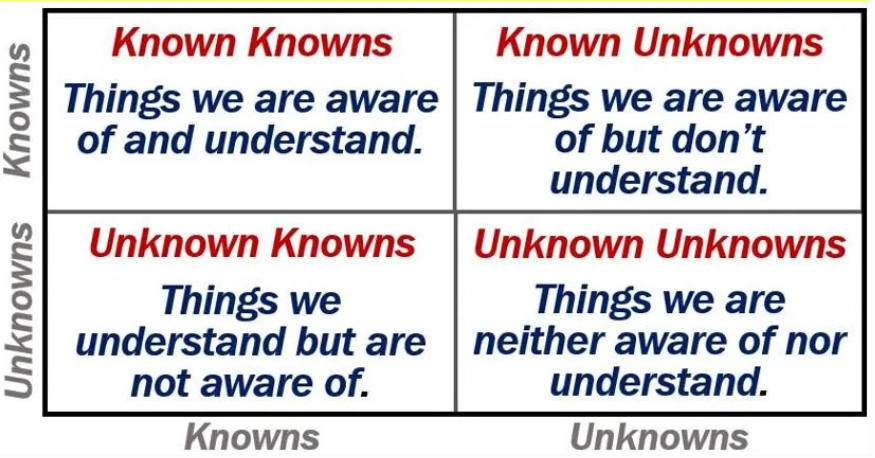
Types of Uncertainty-Matrix
Types of Uncertainty-Matrix
[5]
I. Known known. The things we know we know
II. Known unknown. The thing we know that we can't know, how will the weather be in two month.
III. Unknown known. The things we don't know, but the knowledge exist.
IV. Unknown unknown. The unsertainty that we can't know aboute and can't predict.
Value Proposition Canvas
written by Daniel Bahrin
The Value Proposition Canvas [6] is a tool that can be used to solve the problems of specific customer segments and fulfill their needs, by providing products and services that creates value for the customer. By value we refer to the incentive or attractiveness of a product, that will lead targeted customers to use, purchase or refer a company's product in the detriment of its competitor' offers.
Alexander Osterwalder describes the Value Proposition Canvas as a 'Plug-in' to the Business Model Canvas allowing the project manager to zoom in on creating value for the customers.[7].
The Value Proposition Canvas is composed of two parts - the value proposition map to the left and the customer segment map to the right, as seen in the following figure.
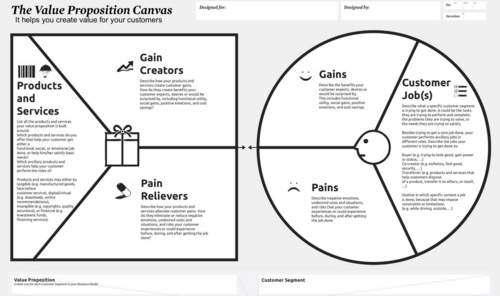
Figure 1: Value Proposition Canvas
[8]
The rights side, or the “Customer segment” defines the reasons behind the project's execution, and show's the issues that the customers are facing and that the company wishes to address, as follows :
Customer Jobs: what are the jobs that the customer wants to perform
Pains: obstacles/issues/threats that the customer encounters before, during or after the job is completed
Gains: the customer's wishes and desired benefits
The left side or the “Value proposition map” defines de deliverables of the project, and the solution to the customer's problems, as follows :
Products & Services: all products and services delivered by the project
Pain Relievers: proposed solutions to the customer's problems
Gain Creators: benefits obtained by the customer through the use of products and services
Business Model Canvas
written by Daniel Bahrin
The business model canvas(BMC) is a great tool to help you understand a business model in a straightforward, structured way [9]. Using this canvas will lead to insights about the customers you serve, what value propositions are offered through what channels, and how a company makes money. The BMC can also be used to understand your own business model or that of a competitor! The Business Model Canvas was created by Alexander Osterwalder, of Strategyzer [10].
The BMC is comprised of 9 key areas, that describe the rationale of how an organization creates, delivers and captures value, as seen in Figure 2.
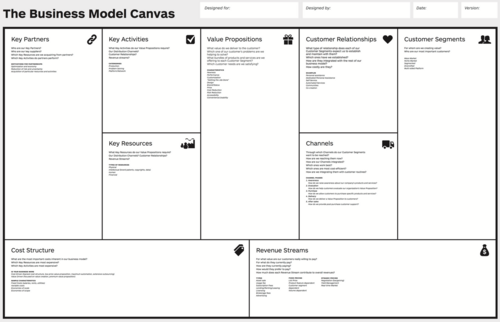
Figure 2: Business Model Canvas
[11]
How to use it :
1. Customer segments : List the top three segments that you are interested in covering as a business. Look for the segments that provide the most revenue.
2. Value proposition : What are your products and services? What is the job you get done for your customer?
3. Revenue streams : List your top three revenue streams. If you do things for free, add them here too.
4. Channels : How do you communicate with your customer? How do you deliver the value?
5. Customer relationships : How does this show up and how do you maintain the relationship?
6. Key activities : What do you do every day to run your business model?
7. Key resources : The people, knowledge, means, and the money you need to run your business.
8. Key partners : List the partners that you can’t do business without (not suppliers).
9. Cost structure : List your top costs by looking at activities and resources.
SMART Goals Technique
written by Daniel Bahrin
S.M.A.R.T Goals or SMART [12], is an acronym that most commonly stands for: Specific, Measurable, Achievable, Relevant and Time-bound goals, and it is a tool that managers can use to guide their goal setting process in order to make their objectives realistic and achievable. An abstract depiction of a SMART goals worksheet is presented in Figure 3.
How to make use of the SMART Technique :
Paul J. Meyer, a businessman, author and founder of Success Motivation International [13] , characterizes the SMART goals in his 2003 book, "Attitude Is Everything: If You Want to Succeed Above and Beyond." [14], and uses the following SMART principles on how to explore, create, develop and achieve your goals:
Specific
Your goal should be clear and specific, otherwise you won't be able to focus your efforts or feel truly motivated to achieve it. When drafting your goal, try to answer the five "W" questions:
   What do I want to accomplish?
   Why is this goal important?
   Who is involved?
   Where is it located?
   Which resources or limits are involved?
Measurable
It's important to have measurable goals, so that you can track your progress and stay motivated. Assessing progress helps you to stay focused, meet your deadlines, and feel the excitement of getting closer to achieving your goal.
A measurable goal should address questions such as:
   How much?
   How many?
   How will I know when it is accomplished?
Achievable
Your goal also needs to be realistic and attainable to be successful. In other words, it should stretch your abilities but still remain possible. When you set an achievable goal, you may be able to identify previously overlooked opportunities or resources that can bring you closer to it.
An achievable goal will usually answer questions such as:
   How can I accomplish this goal?
   How realistic is the goal, based on other constraints, such as financial factors?
Relevant
This step is about ensuring that your goal matters to you, and that it also aligns with other relevant goals. We all need support and assistance in achieving our goals, but it's important to retain control over them. So, make sure that your plans drive everyone forward, but that you're still responsible for achieving your own goal.
A relevant goal can answer "yes" to these questions:
   Does this seem worthwhile?
   Is this the right time?
   Does this match our other efforts/needs?
   Am I the right person to reach this goal?
   Is it applicable in the current socio-economic environment?
Time-bound
Every goal needs a target date, so that you have a deadline to focus on and something to work toward. This part of the SMART goal criteria helps to prevent everyday tasks from taking priority over your longer-term goals.
A time-bound goal will usually answer these questions:
   When?
   What can I do six months from now?
   What can I do six weeks from now?
   What can I do today?
SWOT Analysis
written by Daniel Bahrin
SWOT stands for Strengths, Weaknesses, Opportunities, and Threats, and that translates a SWOT Analysis [15] into a technique for assessing these four aspects of a business.The technique is useful for identifying the organization's current position strength on the market before they decide on any new strategy, as the technique will reveal what's working well, and what's not working so well for them, as well as identifying what they want to achieve in the future and how they might get there.
To get an idea on how this is done, a visual representation of a SWOT Matrix is presented in Figure 4.
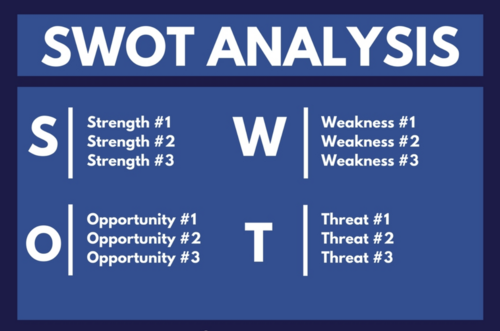
Figure 4: SWOT Matrix
[16]
To understand the four business aspects of the SWOT matrix, the comprising 4 elements, are briefly described in the next lines.
Strengths
Strengths are things that an organization does particularly well, or in a way that distinguishes the from their competitors, such as the advantages the organization has over other organizations. These might be the motivation of their staff, access to certain materials, or a strong set of manufacturing processes.
Weaknesses
Weaknesses, like strengths, are inherent features of the organization, so the focus is on people, resources, systems, and procedures. Emphasize on what the organization could improve, and the sorts of practices they should avoid. Weaknesses can be lack of financial resources, poor management, unqualified personnel,dated technology, resistance to change, weak value proposition, small market share, etc.
Opportunities
Opportunities are openings or chances for something positive to happen for the organization.They usually arise from situations outside of the organization, and require an eye to what might happen in the future. They might arise as developments in the market the organization is currently activating, or in the technology they use. Being able to spot and exploit opportunities can make a huge difference for the organization's ability to compete and take the lead in a market. These don't need to be game-changers: even small advantages can increase the organization's competitiveness.
Threats
Threats include anything that can negatively affect a business from the outside, such as supply chain problems, shifts in market requirements, or a shortage of recruits. It's vital to anticipate threats and to take action against them before the organization becomes a victim of them and their growth stalls.Examples can be the obstacles the company faces in getting their product to market and selling it, or competitors acquiring a technological advantage.
Once all four aspects of SWOT have been examined and all relevant data has been identified, a company will likely be faced with a long list of potential actions to take.Using the knowledge gained from SWOT and other strategy tools, such as the ones provided by Mindtools [17], a company will begin to build on their strengths, boost their weaker areas, head off any threats, and exploit every opportunity before taking any actions.
This process could start by looking for potential connections between the quadrants of the SWOT matrix and use some of the company's strengths to open up further opportunities, or identifying if eliminating some of the company's weaknesses, could lead to a new opportunity. They key aspect and note to take into account after doing a SWOT analysis, is to prune and prioritize the company's ideas, so that the company can focus time and money on the most significant ones.
Gantt chart
written by Patryk Bijak
A Gantt chart is a type of bar chart that illustrates a project schedule, named after its inventor, Henry Gantt (1861–1919), who designed such a chart around the years 1910–1915. Modern Gantt charts also show the dependency relationships between activities and current schedule status. [18]
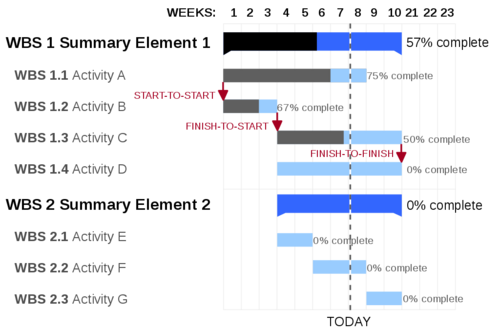
Figure 1: Grantt Chart
[19]
A Gantt chart, or harmonogram, is a type of bar chart that illustrates a project schedule. This chart lists the tasks to be performed on the vertical axis, and time intervals on the horizontal axis. The width of the horizontal bars in the graph shows the duration of each activity. Gantt charts illustrate the start and finish dates of the terminal elements and summary elements of a project. Terminal elements and summary elements constitute the work breakdown structure of the project. Modern Gantt charts also show the dependency (i.e., precedence network) relationships between activities. Gantt charts can be used to show current schedule status using percent-complete shadings and a vertical "TODAY" line as shown here.
Gantt charts are sometimes equated with bar charts.
Gantt charts are usually created initially using an early start time approach, where each task is scheduled to start immediately when its prerequisites are complete. This method maximizes the float time available for all tasks.
Waterfall model
written by Patryk Bijak
The waterfall model is a breakdown of project activities into linear sequential phases, where each phase depends on the deliverables of the previous one and corresponds to a specialisation of tasks. The approach is typical for certain areas of engineering design. In software development, it tends to be among the less iterative and flexible approaches, as progress flows in largely one direction ("downwards" like a waterfall) through the phases of conception, initiation, analysis, design, construction, testing, deployment and maintenance.
The waterfall development model originated in the manufacturing and construction industries; where the highly structured physical environments meant that design changes became prohibitively expensive much sooner in the development process. When first adopted for software development, there were no recognised alternatives for knowledge-based creative work.[20]
Model
In Royce's original waterfall model, the following phases are followed in order:
System and software requirements: captured in a product requirements document
Analysis: resulting in models, schema, and business rules
Design: resulting in the software architecture
Coding: the development, proving, and integration of software
Testing: the systematic discovery and debugging of defects
Operations: the installation, migration, support, and maintenance of complete systems
Thus the waterfall model maintains that one should move to a phase only when its preceding phase is reviewed and verified.
Various modified waterfall models (including Royce's final model), however, can include slight or major variations on this process. These variations included returning to the previous cycle after flaws were found downstream, or returning all the way to the design phase if downstream phases deemed insufficient.
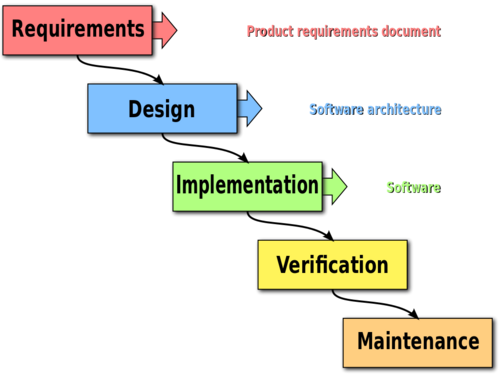
The unmodified "waterfall model". Progress flows from the top to the bottom, like a cascading waterfall.
[21] Product features vs. product benefits
written by Antons Osadcijs
A product benefit is a value that a customer realizes from the product. It is an expression of fulfilling the customer’s need. Customers are more interested in the benefits of the products they are buying than their technical details. Thinking in the domain of benefits instead of features can be used for both marketing purposes as well as for team itself to identify unique sales point of the product.

Features vs. benefits umbrella example
[22] Unique sales point
written by Antons Osadcijs
A unique selling proposition (USP) refers to the unique benefit exhibited by a company, service, product or brand that enables it to stand out from competitors. The unique selling proposition must be a feature that highlights product benefits that are meaningful to consumers.[23]
The triangle model explains three aspects which make your product unique in the market
To identify unique sales point of your product following questions should be answered:
   What is our value proposition?
   How different is our value proposition to our competitors?
   Which are the barriers against imitators of our product?
Kano survey
written by Antons Osadcijs
Kano survey is a tool to characterize product features into three different categories. Not all product features hold the same value in the eyes of customers. Some features create higher levels of customer loyalty and have a greater potential for impacting customer satisfaction than others; these are the ones that the company should ideally focus on [25]
Mandatory features
Are the must-haves of a new product like a login or a user profile. These features are not perceived as adding any value to the product, but they’re expected to be there. They’re the features your product needs.
Linear features
The core features of your product. They’re the two or three features that your customers really pay for. These features are the main value you provide and what you write your marketing collateral around. This is where software companies typically compete.
Exciter features
Those that are not expected by customers, but are perceived as adding value. For example, an accounting solution might have automatic tax calculation or local tax rules and exemptions. These small details help delight the customer, create differentiation, and push the solution over the top.
To perform a Kano survey, you have to list all possible requirements. Then, for each requirement, the objective is to test both the positive and negative forms of the question, trying to capture a respondent’s perception of the feature.
The question pairs allow you to validate how your prospect would feel if a feature were present or absent in the product. For example, a prospect may like that your product has a responsive layout, but they may be able to live without it, making this feature a nice-to-have.
Collecting every respondent’s positive- and negative-form answers allows you to use the following Kano evaluation table to understand individual perceptions of the features.
Data collected can be used for prioritizing tasks and identification of the scope of the project.
Stakeholder Management
written by Ertol Zhurda
In order to better understand the parties of interest regarding a project, the tool "Stakeholder Management" is introduced.
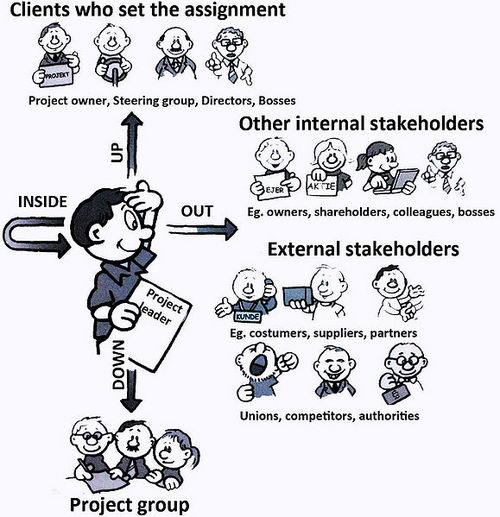
Figure 1: Stakeholders Categories
[28]In the image above the different stakeholders are presented regarding the relationship statues to the project manager, divided into three major categories, up, down and out. "Up" being the ones that have possession and power regarding the projects scope, the "down" involving the parties responsible for the various sub projects and deliverables, and the "out" which consist of different groups and individuals that are either affected or can affect the project process and outcome like customers or partners etc.
Also a diagram is presented below regarding the Power/Interest ratio regarding the different stakeholders and how to categorise and approach them. It is of vital essence to properly understand and behave accordingly to the different stakeholders for a project to be completed successfully, and this tool is hopefully provide the basis for the ongoing project of our team.
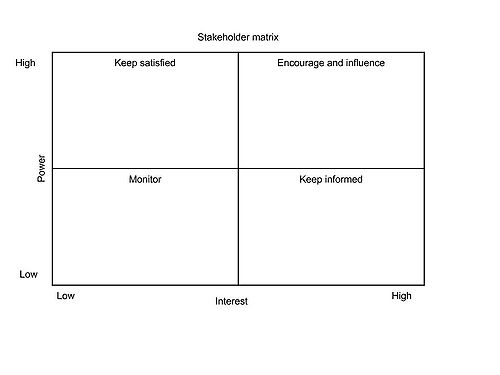
Figure 2: Stakeholders diagram
[29] Milestones in Project Planning
written by Ertol Zhurda
Planning, dividing, and verifying that the tasks are done on time and on budget is essential for a project to run smoothly. In that aspect a very useful tool is the one introduced in this section which is the "Milestones in Project Planning" tool.
The goal of this tool is to identify key activities in the project and provide the project manager a time frame for the various activities to be delivered by the team members. An example is provided in the image below where different tasks are portrayed with their equivalent stages and completion levels.
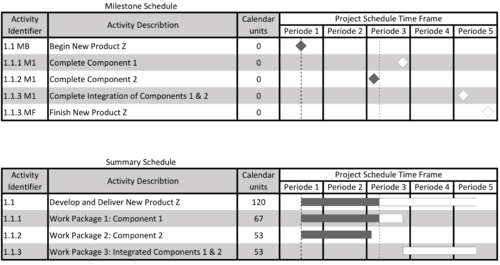
Figure 1: Milestones in Projects
[30]The basis for this tool can be better comprehended by setting the 6 steps that it consists of:
1) Set milestones
2) Set intermediate milestones
3) Create milestone plan
4) Define activities
5) Create project plan
6) Control
It is a tool that we are already using in our project and it already proves that it really benefits the team in total since the project manager can have a clear view on how the project is advancing by the completion level of all the intermediate tasks and deliverables.
References
- ↑ https://remembereverything.org/natural-project-planning
- ↑ http://businessmodelalchemist.com/blog/2012/09/test-your-value-proposition-supercharge-lean-startup-and-custdev-principles.html
- ↑ https://www.smartinsights.com/digital-marketing-strategy/online-value-proposition/start-with-why-creating-a-value-proposition-with-the-golden-circle-model/
- ↑ https://www.ted.com/talks/simon_sinek_how_great_leaders_inspire_action?language=da#t-343111
- ↑ https://marketbusinessnews.com/financial-glossary/financial-glossary-u/unknown-unknowns/
- ↑ https://leandisruptor.com/
- ↑ http://businessmodelalchemist.com/blog/2012/09/test-your-value-proposition-supercharge-lean-startup-and-custdev-principles.html
- ↑ https://leandisruptor.com/
- ↑ https://www.businessmodelsinc.com/about-bmi/tools/business-model-canvas/
- ↑ https://www.strategyzer.com/
- ↑ https://www.strategyzer.com/canvas/
- ↑ https://www.mindtools.com/pages/article/smart-goals.htm
- ↑ https://www.lmi-world.com/smi/
- ↑ https://www.amazon.com/Attitude-Is-Everything-Paul-Meyer/dp/0898113040
- ↑ https://www.mindtools.com/pages/article/newTMC_05.htm
- ↑ https://www.liveplan.com/blog/what-is-a-swot-analysis-and-how-to-do-it-right-with-examples/
- ↑ https://www.mindtools.com/pages/main/newMN_STR.htm/
- ↑ https://books.google.dk/books?id=DOUzfKRA4tkC&pg=PA117&redir_esc=y
- ↑ https://en.wikipedia.org/wiki/Gantt_chart#cite_note-FOOTNOTEMorris19977-2
- ↑ http://sunset.usc.edu/csse/TECHRPTS/1983/usccse83-501/usccse83-501.pdf
- ↑ https://en.wikipedia.org/wiki/Waterfall_model
- ↑ https://convertful.com/landing-page-elements-features-benefits/
- ↑ https://en.wikipedia.org/wiki/Unique_selling_proposition
- ↑ https://www.unternehmertum.de/index.html?lang=de
- ↑ https://leanb2bbook.com/blog/how-to-find-core-features-product-using-kano-surveys/
- ↑ https:https://leanb2bbook.com/blog/how-to-find-core-features-product-using-kano-surveys/
- ↑ https://leanb2bbook.com/blog/how-to-find-core-features-product-using-kano-surveys/
- ↑ http://wiki.doing-projects.org/index.php/Stakeholder_Management/
- ↑ http://wiki.doing-projects.org/index.php/Stakeholder_Management/
- ↑ http://wiki.doing-projects.org/index.php/Milestones_in_Project_Planning/
[3] - https://medium.com/@hsabnis/getting-things-done-action-choices-43f2467d615c
[4] - https://www.slideshare.net/mbaskills01/getting-things-done-51619677


