Utilizing Value Functions for Evaluating the Performance of Project Alternatives
Value functions are a value measurement approach that is often used in multi-criteria decision analysis (MCDA), which strives to improve decision-making. MCDA is a decision support tool used to assess alternatives based on a wide range of criteria, which can be both monetized and non-monetized. [1] [2] To appraise an alternative in a pool of other alternatives, value functions can be utilized to create a fair and less subjective assessment. Value functions are a mathematical model which can translate stakeholder preferences into a measurable scale.
Value functions are especially useful when comparing different choices (here choices can be solution alternatives, project alternatives, or other decision-related alternatives) as it converts the different alternatives and evaluation criteria, into a common scale for a fair and less biased comparison. Value functions assign a specific value to each alternative based on each evaluation/success criteria, also known as key performance indicator (KPI[3]), creating a preferential structure[4]. Value functions can thus support a more structured decision making and ensure better transparency and consistency when evaluating alternatives. Consequently, value functions can assess various aspects of a solution and give a concrete value to each alternative to support a less biased decision basis[5].
As the tool can support various decision-makers in their choices, it can be used in all sorts of decisions. The application is thus broad and primarily depends on how the value function is defined. For use in portfolio management, the value function could be defined based on how well a given project meets an organization’s strategic goals. The project which cumulatively performs best on the value functions (which here are made for each organizational goal or the portfolios KPIs) will thus display the project that is most beneficial to the portfolio. Likewise, program managers can use value functions to identify projects which best fulfill the program’s objectives, to find the project that best balances competing demands and possible trade-offs, and to find the optimal project pool. In projects it can be used to find the best alternative or support the resources allocated to project activities. By determining what alternative, cumulatively, provides the most benefit depending on stakeholder objectives.
This article gives an overview of what a value function is and a guide on how to construct value functions. There will also be a discussion on how to use value functions when handling stakeholders. Finally, this article will discuss some of the limitations of value functions and what to be aware off when using them. The reader should note that this article is focused on value functions used in an MCDA approach, thus they are based on a preferential structure.
Contents |
Value Functions
Value functions are a mathematical model which can translate stakeholder preferences and ideals into a less biased scale. Value functions should be used when the stakeholder needs to choose between alternatives. By creating value functions the stakeholder will be able to continuously identify the alternatives that will give the greatest reward based on the KPIs set out by the stakeholders. A value function is created for each KPI, by combining the relevant measurable attribute of all relevant alternatives into a measurable index of preferability[6]. Value functions can be used to determine the value of a thing by looking at both tangible and intangible aspects. Thus, if done properly, it evaluates all relevant aspects of a project, concept, or idea and ranks the alternatives. The primary function of the value function is to support the stakeholder in assigning value to each alternative based on each criterion, and then use the weight of each criterion to find the final benefit of the alternative. Within the system-oriented problem solving method value functions thus support the selection process in making less subjective decisions and thus creating a trustworthy and unbiased process by rationalizing various stakeholder opinions[7].
Value functions are useful when evaluating and comparing similar alternatives, as they assign a specific value to each alternative, creating a preferential structure. Often when evaluating alternatives several value functions are used, one for each of the KPIs. From these each alternatives performance can be assessed through the specific score that the alternative obtains on the value function scale, creating a less biased decision ground. Consequently their will be less uncertainty in the project, program, or portfolio.
As value functions are a mathematical expression, they follow axioms, the most essential are that the preferences expressed by value functions should be coherent, thus they must be:
- Transitive, meaning that if project a is better then project b, and b is better then project c, then project a is better than c, and
- Complete, meaning that either one project is better than the other or they are indifferent (project a is equally good as project b)[8][9].
Thus an alternative is only preferred to another alternative if its score on the value function is better than the other. If the scores are the same, then there will be indifference between the alternatives, meaning that they perform equally well.
Types of Value Functions
The most used value function model is the additive model:
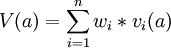
Here V(a) refers to the total value/score of the solution alternative,  refers to the weight (the importance) of criteria i, and
  refers to the value of the criteria for the solution alternative[10][11]. The additive model is easy to use, and especially easy for stakeholders to understand, making it the most used value function. In decision making it is essential that the stakeholder understands the process and thus the indicated solution preference, otherwise they might not trust the results[12][13].
The additive model looks at each criterions impact on the alternatives total value. It is also easy to change, add, and remove criteria from the model.
An alternative to the additive model is the multiplicative model:
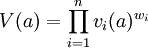
The multiplicative model is harder for stakeholders to understand, however it better accounts for interdependencies between the criteria on the alternative[14] . Thus it is better suited for finding an alternative which performs well on all criteria. This form of value function is best suited when the weights for each criteria is well known and when stakeholders do not have differing opinions on what KPI’s are most essential (stakeholders rarely agree on the importance of KPI’s it is thus paramount here to work around this by using for example the weighted geometric mean of individual opinions[15]). Generally, the additive model is preferred [16].
Creating a Value Function
The Bisectional Method

The bisectional method is a direct method which needs input from stakeholders. Here the stakeholder will identify the two end points of the value function, so the maximum and minimum value an attribute can have (this will depend on the chosen scale, this is explained in the ‘Value Function Scales’ section below). Afterwards the stakeholder will identify where, between the two endpoints, the value is half. So when would the stakeholder consider a solution to have half the value of the maximum outcome[17]?
Let’s consider a program where an objective is reducing emissions. When choosing a project for this program it is thus beneficial to consider how it contributes to the reduction of emissions. The full 100% value (from a global scale, see section ‘Value Function Scales’ below) would be that the project has the potential to remove emissions completely. Whereas a value of 0% (for this criterion) would be that if it does not reduce emissions in any way (as it would be unrealistic to continue with projects which result in larger emissions and go against a program objective). Then using the bisectional method the stakeholders will decide when half the value is reduced, so where is the solution valued half as much as the complete emission reduction is valued. Assuming the stakeholders have to reach certain emission reductions through the program, they would value a larger reduction far more than a small reduction, placing the halfway point closer to the 100% value as they think a project which meets 25% of the required program reduction target gets a value of 50%.
After identifying the 50th quartile the same is done for the 75th and 25th quartile. Where the 75% value is given between the 50% and 100% marker, and the 25% value is given between the 0% and 50% using the same logic as previously. The value function for this specific problem is sketched in figure 1.
Once these five points have been identified it is possible to sketch out the value function and then assign value to the alternatives based on the function. Here it is important that all stakeholders are heard.
The Difference Method

An alternative to the bisectional method is the difference method. Here the stakeholder is presented with a segment of the different values and has to rate them. Here the ranking will provide an idea of the value function shape.
Using the example above, it is possible to use the difference method by using the 0 CO2 emission and the current emission (lets say it is 1 ton ) then using the difference method the difference between these would be segmented into n categories. For simplicity’s sake it is here divided into four categories: 0-250 kg, 251-500 kg, 501-750 kg, and 751-1000 kg CO2 reduction. Then the stakeholder will rate these categories with an increase in value, lets say the larger the reduction the better, as they have reach their emission reduction targets. Then the stakeholder will rank the 751-1000 reduction as the most important, then the 501-750, the 251-500 and finally the 0-250 will be valued the least. The stakeholder might have a reduction goal of 700 less CO2. Thus 751-1000 is above their goal while 0-250 and 251-500 are below. To them the 751-1000 is nice, but 501-750 is essential. Anything below is simply not good enough, so the value function will increase rapidly in the 501-750 interval, while being low in the two preceding intervals, and a little slower in the larger interval.
Once these preferences have been found it is possible to sketch out the value function and then assign value to the alternatives based on the function. The value function for this specific problem is sketched in figure 2.
These methods do not necessarily provide the same value function. Both can provide different insights into stakeholder preferences, and depending on how it is formulated it will also affect the stakeholders opinions, and thus the results[18][19].
Value Function Scales
To assign value to a value function through the methods above it is necessary to define the scale. Only when a scale has been defined is it possible to assign value to the alternatives, and later find the weights of each criterion to get the final value. There are two scales, local and global, the former is defined based on the current alternatives, while the other is based on a broader range of possible alternatives[20].
This means that the local scales outer boundaries are based on the best and worst performing alternatives currently in the pool of alternatives. The best will get a value of a 100 and the worst will get a value of 0. Meanwhile the global scale will assign the best value to the best possible outcome, and the worst to the worst possible outcome. The global scale should for practical reasons, only consider reasonable extremes[21].
There are different benefits to both the local and global scale. The local scale allows for easier and quicker assessment of the alternatives and is beneficial if a rough estimation is fine for the criteria, and if time resources are limited. The global scale, while more time-consuming, is more generic, after creation it will be easier to access new alternatives. When choosing a alternative for a project a local scale can be fitting as time and resources can be limited, especially if it is a one-time decision. In contrast it would be beneficial to use a global scale for repetitive decisions like selecting the best projects for programs, since new alternatives will be added continuously.
Application
Value functions can be used whenever a variety of criteria must be taken into consideration when making a decision. Thus, they can be favorably used in to support important or repetitive decisions. Before creating value functions it is essential to properly understand the problem and objectives. To understand this in the context of project, program, and portfolio management it is necessary to conduct a thorough stakeholder analysis and problem definition[22]. The most essential aspect of creating value functions is to ensure complete transparency for the stakeholders, only when the stakeholder participates in the process will they be able to effectively understand and use the output of the value functions. This will also improve the general outcome of the results as stakeholders will be more aware of their own preferential structures[23].. This is a natural part of the process, as the value function concept expressed here is focused on supporting various MCDA techniques, which to varying degrees include stakeholder opinions and input (popular MCDA techniques are the AHP [24] and SMART[25] techniques).
Defining a Scale

Value functions are created at different stages of various MCDA techniques, thus they can be hard to differentiate. What is essential for all applications however, is to have well-defined criteria. Once a decision-maker has identified their criteria they will be able to define the value functions which make up the decision support system. The next step to creating a value function for a criterion is to define a scale. As mentioned previously the stakeholder must decide whether this scale should be representative for future use, in which case it should be global. Otherwise, if the scale should be easy to create for a quick comparison then the stakeholder should use a local scale. Then a measurable criterion scale should be defined. This means that it should be possible to measue the different alternatives performance on the criteria directly. Such a scale could be cost or time. For multi-layered criteria, like cost or emissions, it can be beneficial to look at more than one measurable scale. Where cost might consider both CAPEX and OPEX related expenses. It is important to properly cover the KPI’s and be explicit about what each value function measures. To keep this on track it is thus beneficial to construct a value tree to structure and visualize how the objectives of the decision is represented[26] an illustration of such a tree can be seen in figure 3.
The scale on which a value function is measured must be well-defined to avoid irregularities in scoring the alternatives and to ensure a good understanding with stakeholders.
If it is not possible to find an suitable scale then the criterion should be reconsidered. If deemed necessary then a qualitative scale can be constructed, though this leaves room for further subjectivity and confusion[27].
Defining the Value Function
The next step will be to decide on what method to use when creating the value function. The choice of which mainly depends on stakeholder and stakeholder preferences. Using the methods described in section ‘Creating a Value Function’ it is possible to understand the stakeholder and stakeholder preferences by attaining their preference structures.

It can be beneficial here to ask the stakeholder what they value most or to obtain certain goals or milestones they have and link it to the wanted output. By matching criteria to the stakeholders objectives it can help measure where most value should be assigned. Sometimes it is more valuable to reach a target, and anything above this target is merely a bonus, while at other times it is more beneficial to get as much or little as possible. This will have to be an individual assessment for each criterion and thus each value function.
Understanding the Value Function


It can be a help to discuss the flow of the value function with the stakeholder. A value function can have three different looks; monotonically increasing against the natural scale, monotonically decreasing against the natural scale, and non-monotonic.
Value functions which are monotonically increasing against the natural scale assigns the most value to the alternative that has the highest scale value. For example, the higher the perceived profit the better the value. Oppositely a value function which is monotonically decreasing against the natural scale assign the most value to the alternative that has the lowest scale value. For example, the lower the perceived resource consumption (time or money) the better the value. Non-monotic value functions have interspaced peaks, meaning that the highest value and lowest value is not at the endpoints. An example of this could be when you are having dinner, it is not good to not eat anything, but it is not good to overstuff yourself either. You want a middle ground. The three different flows are depicted in figure 4, 5, and 6.
Generally non-monotonic value functions should be avoided, as value functions should strive to be as linear as possible. If the created value functions are far from being non-linear it is possible that the criteria should be redefined. However, a bit un-linearity is to be expected to ensure that the problem is not oversimplified, if the value tree is well structured there should not be any issues[28]. The bisectional and difference method both assume that the value function is monotonically increasing or decreasing against the natural scale.
Final Results
After having created the value function using the difference or bisectional method, the value function can determine the value of each of the alternatives. This can most easily be measured visually by taking the alternatives performance value and measuring it up to the value functions value axis. When all alternatives have been measured against each criterion it is possible to find the aggregated results by using the formulas above. Hereafter each alternative will have a specific value, the higher the value the more beneficial the solution.
Limitation
While value functions can be useful, they are not applicable everywhere, and it is essential to be aware of their limitations. It is essential to have the right conditions, value functions are less suitable when there is limited data and where it is hard to connect reliable assumptions from the stakeholders. In such cases the results will be subjective and non-representative of the actual problem. A lack of understanding of the problem and a lack of well-defined objectives will also skew and limit the results of the value function approach. Consequently, it is necessary to use other methods like the utility function when the stakeholder opinions are subject to uncertainty[29].
Besides the applications there are also certain issues with the method that any user should be aware of. First of value functions are subject to objectivity and bias. Depending on the MCDA approach used and despite the mathematical properties, most preferences and inputs are based on stakeholder opinions. It is thus essential to include several stakeholders’ opinions as the results can vary based on stakeholders’ preferences towards various alternatives and criteria. When using value functions always test the result thoroughly through proper sensitivity analysis.
When working out the value functions there is also the possibility of inconsistent preference structure. As mentioned previously some non-linear preferences are allowed, but too much can skew the results. It is thus necessary to ensure that the value functions follow the axiom of transitivity and have a linear tendency. This requires proper stakeholder management and transparent communication. When these limitations and issues cannot be handled properly other alternatives for determining the weight of the criteria. Such alternatives could be construction of qualitative value scales, utility functions or direct rating of the alternatives.
When using value function for long-term continuous decisions the stakeholder and users should test the system regularly to ensure that the criteria, weights, and scales are still relevant and properly evaluated. This should be done to avoid that the system does not become redundant or misinterprets the actual opinions and preferences.
Annoted Bibliography
- The book 'multiple criteria decision analysis: an integrated approach' gives a good overview of how value functions work and how they are constructed. It provides relevant mathematical insights into the topic.
- Decisions with Multiple Objectives – Preferences and Value Tradeoffs provides good information on MCDA methods, and how these function. THis material is relevant for anyone wishing to further studymulit-criteria decision analysis and tools within this topic apart from value functions.
- An MCDA approach for the selection of bike projects based on structuring and appraising activities gives a good overview of how an MCDA can be carried out, along with limitation to consider
Reference
- ↑ Thomsen, C. L. (2018). Multi-criteria decision making (MCDM) for Project selection- http://wiki.doing-projects.org/index.php/Multi-criteria_decision_making_(MCDM)_for_Project_selection
- ↑ Barfod, M. B. and Leleur, S. (2021). Decision Support and Strategic Assessment. DTU course 42879, Compendium.
- ↑ N.a (2019) Key Performance Indicator (KPI)- http://wiki.doing-projects.org/index.php/Key_performance_indicator_(KPI)
- ↑ Belton, V. and Stewart, J.T. (2002), Multiple criteria decision analysis: an integrated approach, Kluwer Academic Publishers, London.
- ↑ Barfod, M. B. and Leleur, S. (2021). Decision Support and Strategic Assessment. DTU course 42879, Compendium.
- ↑ Keeney, R.L., and Raiffa, H. (1993). Decisions with Multiple Objectives – Preferences and Value Tradeoffs. Cambridge University Press.
- ↑ Haberfellner, R., de Weck, O., Fricke, E., and Vössner, S. (2019). Systems Engineering Fundamentals and Applications. Birkhäuser.
- ↑ Belton, V. and Stewart, J.T. (2002), Multiple criteria decision analysis: an integrated approach, Kluwer Academic Publishers, London.
- ↑ Barfod, M. B. and Leleur, S. (2021). Decision Support and Strategic Assessment. DTU course 42879, Compendium.
- ↑ Belton, V. and Stewart, J.T. (2002), Multiple criteria decision analysis: an integrated approach, Kluwer Academic Publishers, London.
- ↑ Keeney, R.L., and Raiffa, H. (1993). Decisions with Multiple Objectives – Preferences and Value Tradeoffs. Cambridge University Press.
- ↑ Guitouni, A. and Martel, J.-M. (1998). Tentative guidelines to help choosing an appropriate MCDA method. European Journal of Operational Research, 109:501–521.- https://www.sciencedirect.com/science/article/pii/S0377221798000733
- ↑ Barfod, M. B. (2012). An MCDA approach for the selection of bike projects based on structuring and appraising activities. European Journal of Operational Research, 218:810–818.- https://www.sciencedirect.com/science/article/pii/S0377221711010472
- ↑ Belton, V. and Stewart, J.T. (2002), Multiple criteria decision analysis: an integrated approach, Kluwer Academic Publishers, London.
- ↑ Hansson, J., Brynolf, S., Fridell, E., and Lehtveer, M. (2020). The Potential Role of Ammonia as Marine Fuel - Based on Energy SystemsModelling andMulti-Criteria Decision Analysis. Sustainability (Switzerland), 12.- https://www.mdpi.com/2071-1050/12/8/3265
- ↑ Barfod, M. B. and Leleur, S. (2021). Decision Support and Strategic Assessment. DTU course 42879, Compendium.
- ↑ Barfod, M. B. and Leleur, S. (2021). Decision Support and Strategic Assessment. DTU course 42879, Compendium.
- ↑ Guitouni, A. and Martel, J.-M. (1998). Tentative guidelines to help choosing an appropriate MCDA method. European Journal of Operational Research, 109:501–521.- https://www.sciencedirect.com/science/article/pii/S0377221798000733
- ↑ Barfod, M. B. (2012). An MCDA approach for the selection of bike projects based on structuring and appraising activities. European Journal of Operational Research, 218:810–818.- https://www.sciencedirect.com/science/article/pii/S0377221711010472
- ↑ Barfod, M. B. and Leleur, S. (2021). Decision Support and Strategic Assessment. DTU course 42879, Compendium.
- ↑ Barfod, M. B. and Leleur, S. (2021). Decision Support and Strategic Assessment. DTU course 42879, Compendium.
- ↑ Portfolio Management: The standard for portfolio management, 4th Edition (2018)- https://findit.dtu.dk/en/catalog/2447043653
- ↑ Program Management: The standard for program management, 4th Edition (2017)- https://findit.dtu.dk/en/catalog/5c45c08ad9001d2f38206ba6
- ↑ AHP_as_a_Decision_Making_Tool_in_Projects,_Programs_and_Portfolios- http://wiki.doing-projects.org/index.php/AHP as a Decision Making Tool in Projects, Programs and Portfolios
- ↑ Simple Multi-Attribute Rating Technique (SMART)- http://wiki.doing-projects.org/index.php/Simple_Multi-Attribute_Rating_Technique_(SMART)
- ↑ Barfod, M. B. and Leleur, S. (2021). Decision Support and Strategic Assessment. DTU course 42879, Compendium.
- ↑ Belton, V. and Stewart, J.T. (2002), Multiple criteria decision analysis: an integrated approach, Kluwer Academic Publishers, London.
- ↑ Barfod, M. B. and Leleur, S. (2021). Decision Support and Strategic Assessment. DTU course 42879, Compendium.
- ↑ Keeney, R.L., and Raiffa, H. (1993). Decisions with Multiple Objectives – Preferences and Value Tradeoffs. Cambridge University Press.