APPPM Tools Force technology
This article is a product of literature review associated with the case study of founding a new department within Force Technology. The article provides a description of different selected tools within the APPPM framework to be considered when analyzing current and future state of the company and recommending APPPM strategies.
Contents |
Benefits register
Benefits register is a document that collects and lists the planned benefits from a program. It is a very useful artifact for a program manager because the success or failure of a program is determined primarily by the benefits that were planned and actually delivered. The benefits register is created during the benefits identification stage of program management (PMI) and subsequently updated and refined. It is used for measurement and communication. The benefits register should contain the following.
- A list of the planned benefits
- Key Performance Indicators (KPI) that will tell if the benefits have been realized
- Thresholds (e.g. “What is the minimum expectation in regard to a certain benefit?)
- Method of measuring the benefit (e.g. financial measures for financial benefits. Can be more complex for intangible benefits like “team well-being")
- Mapping of planned benefits to program components (which components are responsible for realizing a benefit?)
- Status or progress indicator (how far is the realization of the benefit?)
- Milestones for benefit achievement
- Stakeholders responsible for benefit delivery
Benefits realization plan
A Benefits Realization Plan is created during the benefits analysis and planning phase of program management (PMI). The benefits realization plan formally documents the activities necessary to achieve the program’s planned benefits. The plan should achieve the following purposes:
- Define the benefits and how they will be achieved
- Link the component outputs clearly to the program outcomes
- Define the metrics for measuring the benefits
- Define the roles and responsibilities for benefits management
- Define how the benefits will be transitioned and sustained (who will receive them and how will they be sustained?)
- Establish a process to monitor the extent to which a program is able to meet the desired benefits
Business Model Canvas (BMC)
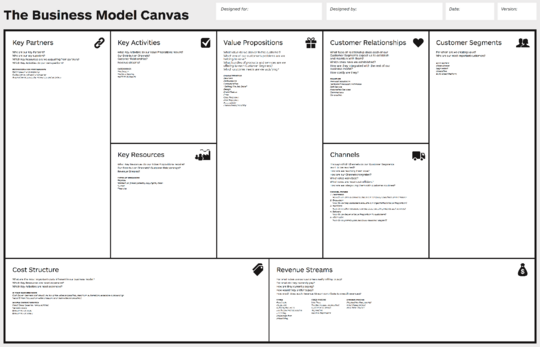
The Business Model Canvas is a tool for systematically develop new or documenting existing business models. It helps scope an organizations business model by a series of building blocks that are interdependent and influential on each other.
Key Partners
Who are the key partners/suppliers?
What are the motivations for the partnership?
Key Activities
What key activities does the value proposition require?
What is the organizations key product/service?
Value Proposition
What core values do the organization provide?
What costumer needs are the organization satisfying?
Costumer Relationship
How do the organization interact with the costumer?
Costumer Segment
Which type of costumer do the organization create value for?
Who is the most important customer?
Key Resources
What key resources does the value proposition require?
What resources are important in distribution channels, customer relationships, revenue stream…?
Distribution Channel
Through which channels do the customers want to be reached?
Which channels work best?
How can the channels be integrated into the organizations’ and your customers’ routines?
Cost Structure
What is the organization spending money on?
Which key resources/activities are most expensive?
Revenue Stream
For what value are the customers willing to pay?
What and how do they recently pay? How would they prefer to pay?
How much does every revenue stream contribute to the overall revenues?
Value Proposition Canvas (VPC)
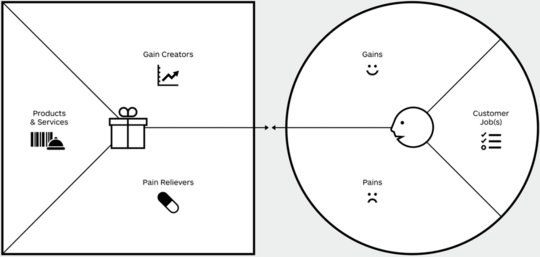
The Value Proposition Canvas can be described as an addition to the Business Model Canvas, which both gives the opportunity to go into more detail in describing the Value Proposition and ensure that there is a connection between the business model, customer segment and Value Proposition. The model is divided into two parts. A customer section and a product section that both correspond to the corresponding parts of the Business Model Canvas.
Start of by describing the costumer segment.
- 1) Costumer Jobs
- Consider what “jobs” they have that need to be addressed. What do they want to get done?
- 2) Pain
- What pains do they experience? What frustrates them by costs, experience, time, budget etc.
- 3) Gain
- What gains do they want to experience? What do they expect?
A good exercise is to prioritize these three elements. What jobs, pains and gains are most important to your customer? Then design the value proposition.
- 1) Product and services
- List the products or services the organization has or potentially can develop that could solve the “costumer jobs”.
- 2) Pain relievers.
- How does the products/services help the costumer to experience less “pain”?
- 3) Gain Creators.
- How does the products/services create value or “gains” for the costumers?
Make sure the pain relievers match the costumers’ “pains” and that the products and/or services match the costumers’ most important “gains”. Next, check to see if the image of the customer segment holds. Then adjust the value proposition according to the results. If you have several customer segments you can design a value proposition for each of these.
The Golden Circle
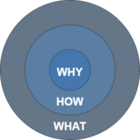
The Golden Circle is a tool to help create a purposeful driven project by asking the three questions: why? How? And what? These questions help clarifying the purpose and scope of a project. Though this tool seems rather redundant, it tends to be a catalyst for a purposeful scope of a project. The Golden Circle is defined by author and organizational consultant, Simon Senik, who states: ”Companies focusing on why they do it are more likely to succeed compared to companies focusing on what they are doing”
Power Interest matrix
The Power Interest Matrix (influence versus interest) is a tool intended to create an overview of the stakeholders’ position in a project, program or Portfolio. The matrix shows how much influence (Power) and/or interest a stakeholder has on/in the project, program or portfolio. In more advanced models a suggestion for how to handle or communicate with the stakeholder, is also displayed. One stakeholder at a time they are placed in the matrix according to how much interest (horizontal axis) and power/influence (vertical axis), they have. For example, an investor more or less always has very high influence on a project but may not have very much interest.
RACI diagram
RACI or R.A.C.I. is an acronym for Responsible, Accountable, Consulted and Informed. The R.A.C.I. diagram is a tool that can help identify if certain activities may encounter problems. It can also help to identify if a person may be overloaded in a certain area.
The diagram consists of all the relevant stakeholders (as the columns) and all the activities (as rows) of the scope. For every activity there must be a stakeholder who is accountable and one that is responsible. It does not have to be the same. There can be only one person who is accountable for an activity. Not all stakeholders have to be associated with every activity. Informed is used for stakeholders who merely needs to be aware of the activity and consulted is for a stakeholder from who the activity needs something.
If an activity has a lot of stakeholders who needs to be consulted it can indicate that the activity needs to be monitored closely as the process of getting information from various stakeholders can be time consuming and therefore lead to missing deadlines or failed completion.
Output, Outcome, Benefits
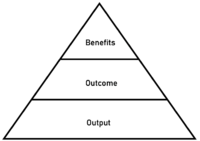
The “Output, outcome, benefits” tool is typically used to specify a purpose by scoping it into three subcategories: the project’s output(s), outcome(s) and benefits. These subcategories help to gain a clearer understanding and overview of a project. This tool can be used early in a project phase to create a common understanding for the wanted result(s) of a project.
Cause and Effect Diagram
A cause-and-effect diagram (also called fish bone diagram or Ishikawa diagram) is a graphical representation of the causes behind an effect.
The diagram is helpful in the process of gaining an overview of the causes behind an effect. Along the large horizontal line are branches the depicts the major causes, on these are subbranches that depicts root causes. The diagram can include as many branch-levels as required. The diagram can also be a useful method to depict causes under different categorizes.
Program Roadmap
The Program Roadmap depicts the programs strategic alignment and sets up a timetable for the delivery of strategic benefits. The Program Roadmap is used to get a graphically overview of a program’s direction and the dependencies between different components and milestones. It is a valuable tool for the assessment of a program’s progress and can be used to track if the program is achieving the expected goals and benefits.
A Program Roadmap is a chronological representation of the programs activities and intended direction. It can include major milestones like decision points and deliverables. The roadmap helps to establish the linkage between the planned strategy and the planned work in the program.
SMART Criteria
In order to successfully reach a goal, it is important to create “SMART” criteria. The word smart is an acronym for: specific, measurable, achievable, realistic and time bound. This tool analyses and evaluates whether criteria are clear and reachable. If a criterion fulfills all the five categories, it is considered smart.


