A method to analyze visualizations in project management as boundary objects
Developed by Eva Schultz Hansen
The method visualization is used as an important communication tool in project management. It is used in project management through many different methods that either have the sole purpose of being a visual as a communication tool, or have visualization as well as other purposes. I argue that by contextualized visualization within a wider scheme of it's creation and it's use, it will enable us to understand the method more holistically, thus improve it's application and make this method more valuable. This will be done by introducing the notion of boundary objects and understanding visualizations as such. Viewing visualizations as boundary objects thus address the limitation of the visualization method through the generation of three boundary object criteria.
This article will initially define visualization and boundary objects. Following this, a discussion of visualizations as boundary objects will be made. This leads to the generation of three boundary object criteria. It's my hope that these criteria will enable primarily project managers to improve their understanding and application of visualizations in project management.
Contents |
Definition of visualization
A visualization is used in project management as a communication tool, where visualization is the process of visualizing as well as the physical (or digital) visual (a visualization). In project management many different forms of visualizations are used e.g. visuals of the organization's vision, their product development process etc. Visualizations also include visuals of methods such as gantt or PERT charts (which additionally also serves other purposes). Visualization is more specifically defined as "The process of representing abstract business or scientific data as images that can aid in understanding the meaning of the data"[1].
A visualization can be defined by three minimal criteria [3]:
- It is based on data. The purpose of a visualization is to communicate data, thus the data arrives from something that is not immediately visible.
- The result must be readable and recognizable. A visualization must enable actors to learn something about the data.
- It produces an image. Seemingly obvious, a visualization must produce an visual image.
Observing especially the second criteria more closely can lead to a question of how a visualization is readable and recognizable and which actors this implies. In other words how effective a specific visualization is. I argue that this is highly depending on the context for example the specific visualization method, the vision or idea behind it and especially which actors are communicating what to whom. Introducing communication between different actors leads us to the introduction of boundary objects.
Boundary Objects
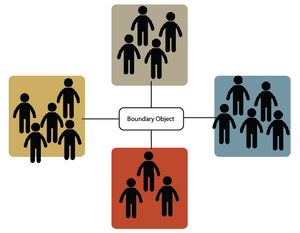
The notion of boundary objects was first introduced by Star and Griesemer in 1989. As they explain:[5]"Boundary objects are objects which are both plastic enough to adapt to local needs and constraints of the several parties employing them, yet robust enough to maintain a common identity across sites... They have different meanings in different social worlds but their structure is common enough to more than one world to make them recognizable means of translation". Boundary objects can for example be in the form of maps, field notes, drawings, different prototypes and standardized forms.
To understand boundary objects one needs to have a sense of social worlds and thereby a understanding of the sites the boundary object has to come across. Social worlds entails domains in which actors have shared beliefs and commitments about what is important [6]. These actors thereby have a common understanding and a common set of interests and perceptions in a given situation. This also entails that actors from different social worlds have different beliefs and understandings of what things mean and a different agenda and interests. This is why projects involving actors from different social worlds needs interaction that is focussed on negotiating consensus despite their different perceptions and sometimes conflicting interests. Boundary objects are used as past of this negotiating process and create a common understanding across sites. To be able to do this effectively, boundary objects must be robust or rigid but at the same time flexible. If a boundary object is too flexible but not rigid enough the boundary object will not create a common understanding because it can still be understood differently across the different domains. However, if the boundary object is too rigid it can only be understood in some social worlds and are too detailed or technical to be understood in others.

An example could be a drawing of a new cultural center in a municipality involving the architect, the consultants from the municipality and the citizens. If the drawing is very technical it might only be used by the architect whereas the consultants and the citizens can not make sense of it. On the other hand, if the drawing is too flexible it might leave too much room for interpretation. Thereby, all three groups of actors might expect a different outcome which in turn will create different expectations and a lot of communication issues. As an effective boundary object the drawing might thereby be rigid enough and show some technical details but at the same time flexible enough so e.g. the citizens do not need to be professional architects to understand the drawing. Hereby all three groups of actors can have a common understanding of the project overall. The boundary object is rigid and flexible enough so all three groups can use the drawing for their own purpose in their own social world, but also create a common understanding across the domains. Thus, when used effectively, boundary objects have the possibility to enable integration of knowledge across boundaries and thereby bridge the gaps between the social worlds. In the example it could be that through the drawing the all the actors can communicate expectations and needs to the other actors and negotiate what the cultural center should include and exclude - thereby bridging the gap between the domains in aspect to the new cultural center. However, it is important to note that actors from the different social groups still might give different attributions of meanings to the boundary objects, however, the overall understanding is common across sites.
It's important to understand the context in which the boundary objects are used. Susan Leigh Star stresses the fact that boundary objects are created when members of different social worlds or communities much collaborate and negotiate so they have a specific, common "work and information requirement"[8]. This not only entails which different social worlds the actors inhabit but also the context in which the boundary objects came into being. In the example above, the boundary object will differ according to which set of actors that created it e.g. if the consultants and citizens made the drawing without the involvement of the architect a outcome might be that it won't be possible to actually build the building. However, if the architects made the drawing exclusively, it might entail a building that does not meet the need of the two other groups. This could for instance be in relation to the price or the actual use of the building.
Visualization as boundary objects
Decades of research support that heterogeneous project teams preform better than homogeneous project teams thus giving one explanation for why these teams are oftentimes heterogeneous[9] [10], which in turn makes communication critical for successful project management. I argue that a limitation of the visualization method is, that it is mostly concerned with the method and visual itself but not it's context of use. However, seeing project management visualization as boundary objects enables us to view the method more holistically and include the notion of the entire process of creation, use as well as the visual itself.The boundary object framework thus extent our understanding of visualization.
Visualization can be used as a method to communicate data in project management and create and communicate a overview of the date. However, as a boundary object, visualization also acts as objects enabling the necessary social interaction and integration of knowledge across boundaries and within the in tire organization[11]. Social interaction is necessary in a heterogeneous team where the actors oftentimes have conflicting interests and perceptions. Visualizations as boundary objects does not only communicate specific date but also helps create a common understanding with shared meanings in a otherwise diverse group of people.
Seeing visualizations as boundary object extend the notion of an effective visualization. Not only does it have to be readable and recognizable but it also have to take into account the context of it's use, involved actors and it's creation. This article aims to generate three boundary object criteria that a project manager will be able to apply to make a specific visualization more effective as a boundary object and thereby more effective overall.
Criteria Development
Three boundary object criteria will be developed in order to improve visualization in project management. All three criteria are intertwined and cannot be seen as separated. Understanding these criteria is a iterative process of ‘deciding’ at one criteria, but later turning back and changing the outcome after acquiring more knowledge.
Flexibility of the Actual Object
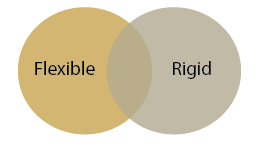
Boundary objects need to be both flexible yet rigid. This criterion is focused on this exact balance in the actual physical/digital object. The involved actors are from different social worlds thus per definition they have a different understanding and have different interests. If the visualization is too flexible all actors will have a different understanding of it and won't find 'common ground'. Thus the visualization will not communicate knowledge effectively across boundaries. On the other hand – by having a visualization that is too rigid, actors will be excluded since they will not be able to make sense of it and the date and overview the visualization should communicate will be lost for these actors.
When a visualization is too flexible, it can be understood in ways that vary too much thus the actors do not have a common understanding. In relation to timelines such as Gantt charts, a task might be too flexible defined. The actors could then scope the task differently and ending in not being able to synthesis each actors contribution. Another example could be that the allocation of tasks are too flexible. An outcome could be that team member ‘’A’’ believes team member ‘’B’’ will deliver the task and ‘’B’’ believes ‘’A’’ would do it. They may even deliver ‘wrong’ tasks based on different interpretation of the data in the visualization.
On the other end of the scale would be a visualization being too rigid and constrained. An example could be a very detailed financial template visualized. The economist can make sense of it. However, let’s say the project team includes a graphic designer that does not know anything about finance. The visualization is then so specific, detailed and ‘closed’ that the designer might not be able to make any sense of it or apply it at all. A boundary object both too flexible or too rigid, will loose it’s effectiveness as a boundary object to create a common understanding and integrate knowledge across boundaries.
Applying this criteria is about analyzing visualizations through boundary object framework specifically understanding the balance between flexibility and rigidity.
Degree of Common Understanding
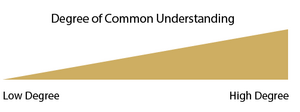
Finding the right balance between flexibility and rigidity depends on the actors that are involved. Essentially how high degree of common understanding there is in the context of the specific visualization.
- First step is to consider which actors the boundary object need to bring together. Is the visualization for 'internal' use in the project team or will it be used for also 'external' e.g. top management, suppliers, customers/users?
- Second step is then considering how much the social worlds vary thus how different all the included actors interpretations might be.
High degree of common understanding can be found in an establish project team that have use the specific visualization before and thereby might already have created a similar understanding of the key attributes. If this is the case, the boundary object can be more rigid and the need for flexibility is lower. Low degree of common understanding entails that the actors are from very different social worlds, and thereby assuming they don't have a common understanding of the visualization already.
Integration Level
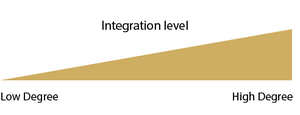
Levina and Vaast [15] differentiate between designated boundary objects and boundary objects-in-use. Designated boundary objects are ’artefacts that are designated as valuable for boundary spanning, due to their design and properties’. Typical, powerful actors such as top managers designate a specific tool to be used in the project, which may or may not become boundary objects-in-use. Boundary objects-in-use are ’artefact that have meaning and are useful for the work practices of different groups of actors, and which acquire a common identity across groups’. For example, within a manufacturing plant, Bechky [16] found that the designated boundary object was the engineers’ blueprint of a machine. However, prototypes of the actual machine became the actual boundary objects-in-use since they had much more meaning and thereby were more useful for the work being done by assemblers and technicians. Whether it becomes a boundary object-in-use is determined by how an artefact is used. Thus, boundary objects are perceived as useful when they are in use. However, the use can appear within different episodes, such as limited to discussion in the project planning or repeating use throughout the entire project.
This criteria is focused on to which degree the visualization is integrated in the project work. It's important to understand whether or not the visualization are being used (even in episodes).Designated boundary objects begs the question of who designates the boundary object and who is included and excluded from this process?
Limitations
This article addresses some of the limitations regarding visualization as a method in project management by introducing visualizations as boundary objects. This section will address some of the most relevant limitations in the generated boundary object criteria
The boundary object criteria as theoretical and as such difficult to apply in practice which out extensive knowledge on boundary objects etc. Using boundary object criteria is based on two major assumptions: 1) that the actors applying the criteria (specifically the project manager) have a understanding of boundary objects and 2) that these actors have enough knowledge about the situation in which the boundary object will be applied. However, seeing how projects change over time it might be difficult to predict things, as well as assuming that the project manager has this knowledge when planning to apply a visualization. The use of some visualizations and processes are determined elsewhere in the organization as noted in the third criteria. This also means that even though the project manager or project team uses these criteria to improve their visualizations, there might be some overall political agendas or systems that makes it impossible to apply these changes anyway. This hints at a very important limitation to the boundary object criteria - motivations. Even though the boundary object create a common understanding across domains it does not include politics and motivations that are at stake and which might play an even stronger role than common understanding. A
Conclusion
Understanding visualizations as boundary objects extent our understanding of visualizations from both it's creation and use. It entails looking closer at the actors involved in the process and how these differ and are similar. Through this understanding three boundary object criteria was generated theoretically. These criteria focus on three key attributes - 1) flexibility of the actual object, 2) degree of common understanding among the involved actors and 3) how integrated the boundary object is in the project team's work. By applying these criteria a project manager will be able to make visualizations more effective as boundary objects. I argue that this will make them more effective overall as visualizations.
Annotated Bibliography
- ↑ Multimedia and graphics glossary - Visualization. [online] http://whatis.techtarget.com/definition/visualization. [Accessed 20. September 2015].
- ↑ WHITEPAPER: The visual Approach to Improving Project Management [online] http://blog.mindjet.com/2015/01/whitepaper-pm-visualization/ [Accessed 27. September 2015].
- ↑ Visualization and Visual Communication. [online] https://eagereyes.org/criticism/definition-of-visualization. [Accessed 20. September 2015].
- ↑ Made specifically for this article (2015) ‘A visual of a Boundary object’.
- ↑ Star, S. L. and Griesemer, J. R (1989) 'Institutional Ecology, "Translations" and Boundary Objects: Amateurs and Professionals In Berkeley's Museum of Vertebrate Zoology, 1907-39', Social Studies of Science 19(3): 387-420.
- ↑ Hodgson, D. and Cicmil, S. (2006) 'A framework for understanding sense-making in projects', Making Projects Critical (Management, Work and Organisations: 321-322.
- ↑ Mariehøj Kulturcenter. [online] http://www.rasmusbronnum.dk/category/arkitektfaglighed/page/24/. [Accessed 27. September 2015].
- ↑ Boundary Objects: A field Guide. [online] http://scalar.usc.edu/works/boundary-objects-guide/boundary-objects?path=index. [Accessed 27. September 2015].
- ↑ How Diversity Makes Us Smarter. [online] http://www.scientificamerican.com/article/how-diversity-makes-us-smarter/. [Accessed 21. September 2015].
- ↑ How Diversity Spells Success. [online] http://www.ryerson.ca/news/news/Research_News/20140228-how-diversity-spells-success.html.
- ↑ Chesley, J. and Wenger, M. (1999) 'Transforming an Organization: Using Models to Foster a Strategic Conversation', California Management Review 41(3): 54-73
- ↑ Made specifically for this article (2015) ‘A visual of flexibility and rigidity.
- ↑ Made specifically for this article (2015) ‘A visual of degree of common understanding.
- ↑ Made specifically for this article (2015) ‘Degree of Integration.
- ↑ Levina, N. and Vaast, E. (2005) 'Strategic Planning as an Integrative Device', Administrative Science Quarterly 49(3): 337-65.
- ↑ Bechky, B. A. (2003b) 'Object lessons: Workplace artifacts as Representations of Occupational Jurisdiction', American Journal of Sociology 109(3): 720-52
A short description of the key references. Other references refers to illustrations made for this article specifically.
- Star, S. L. and Griesemer, J. R (1989) 'Institutional Ecology, "Translations" and Boundary Objects: Amateurs and Professionals In Berkeley's Museum of Vertebrate Zoology, 1907-39', Social Studies of Science 19(3): 387-420.
Annotation: Star and Griesemer first introduced the notion of boundary objects through this article. The article itself present a model of how a group of diverse actors managed the tension created by their divergent viewpoints. The article is around the work at the Museum of Vertebrate Zoology at the University of California, Berkeley and draws on the work of administrators, professionals, amateurs and other connected the the museum. They explain how two activities are central for the work of translating between the actors divergent viewpoints: the development of boundary objects and a standardization of methods. They also distinguish between four types of boundary objects.
- Boundary Objects: A field Guide. [online] http://scalar.usc.edu/works/boundary-objects-guide/boundary-objects?path=index. [Accessed 27. September 2015].
Annotation: A webpage explaining boundary objects and how the framework was created.
- Hodgson, D. and Cicmil, S. (2006) 'A framework for understanding sense-making in projects', Making Projects Critical (Management, Work and Organisations: 321-322.
Annotation: This book is a edited collection of a range of international scholars. They are linking the acres of project management with critical management perspectives.
- Levina, N. and Vaast, E. (2005) 'Strategic Planning as an Integrative Device', Administrative Science Quarterly 49(3): 337-65.
Annotation: The notion of designated versus in-use boundary objects.
- Bechky, B. A. (2003b) 'Object lessons: Workplace artifacts as Representations of Occupational Jurisdiction', American Journal of Sociology 109(3): 720-52
Annotation: Explanation of a factory case with the use of boundary objects. This is especially in regards to designated vs. in-use boundary objects.