Design Structure Matrix and its application in project communication
Developed by John Gomes
Every big project or program involves a large diverse group of people working and collaborating together towards common objectives, goals or deliverables. This often results in complex relationships of tasks and people. One of the key aspects of managing such complex relationships in projects is by ensuring that the people/teams are communicating the right information at the right time. But in order to do that, it is first and foremost necessary to understand the network and the interdependency between people/teams. This is where the tool Design Structure Matrix can come in handy.
In this article, the tool Design Structure Matrix (DSM) is explained. The theoretical concepts and applications are explored with a focus on the application of DSM within program management. Using Pratt and Whitney’s PW4098 engine development as a case, the application of DSM as an Alignment Matrix is explained. The application of both Design Structure Matrix and Alignment Matrix is finally reflected upon from a program management perspective drawing on insights on how projects communicate and coordinate within a program.
Contents |
Description of the tool
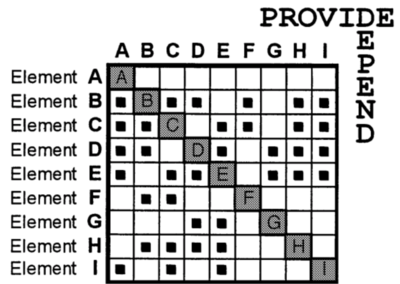
Design Structure Matrix or DSM is a compact, matrix representation of a system or project. The tool has existed in graph theory before, but work by Tyson R. Browning (2001) and Ali Yassine (2003) in fields of systems engineering and project management has made this tool a subject of interest and relevance in this course. While many of the tools like Gantt charts and PERT allow sequential modeling of processes, they do not address interdependencies, especially when it comes to complex product development projects (A. Yassine). DSM is a powerful tool that helps visualize these interactions, exchange of information and dependency patterns between sub-systems. There are two types of DSMs, static and time-based. Elements like components of product architecture and groups in an organization are examples of static DSM while time-based activities with precedence conditions constitute time-based DSMs. The tool can be implemented on an IT platform or it could be a simple Excel sheet or paper. Four basic types of interdependency data can be represented on a DSM. They can represent information relations among components of a product, teams working on a project, activities or tasks and parameter (Browning, 2001). The subsystems or elements are filled in the row and column headers of the table and the interdependency data are then mapped onto the matrix like the figure below.
Concept/Theory
Understanding complex systems like products, processes, and organizations can be a challenge. Interdependencies between subsystems (elements) can often be difficult to show or document and can be the causes of system behaviors. A classical approach to understanding complex systems is to model it by breaking it down into subsystems which are easier to comprehend. Those same interdependencies seem much more clear and easy to grasp when modeled or mapped on a matrix cause of the simple and graphical nature of a matrix. Besides, the tool is compact and systematic which makes it easy to use no matter the size of the system.
For better understanding, consider a simple two element system, with elements “A” and “B”. Those two elements can have the following three interdependency configurations. Either they both function in parallel and are concurrent systems, or one system element is dependent on another or finally, or the system elements are coupled and are interdependent. If these configurations are to be modeled on a directed graph (diagraph) with nodes as the system elements and directed links (arrows) showing interdependencies, then they can be modeled as shown below.
However, if these same three configurations were to be represented by a matrix, then it could be done in a binary square where 1 (or a mark like a dot or X) marks the dependency of an element in the row to the corresponding element in the column at the intersection.
Considering that most systems have several elements, the matrix structure appears to be a practical and applicable tool as discussed above. Additionally, the data representation within cells of a matrix can be adapted to show varying degrees of dependency.
Purpose
Below, is a whole range of applications of the tool corresponding to the data types ranging from performing system analysis to systems design. This article will be focusing on an application in performing system analysis. Team-based and component-based DSM types are static DSMs and are usually analyzed with clustering algorithms. A detailed explanation of clustering can be found in the reference ( T. U. Pimmler, S. D. Eppinger, "Integration Analysis of Product Decompositions", Proc. ASME 6th Int. Conf. on Design Theory and Methodology, 1994.) and can be the scope for a future article.
The application process (in general)
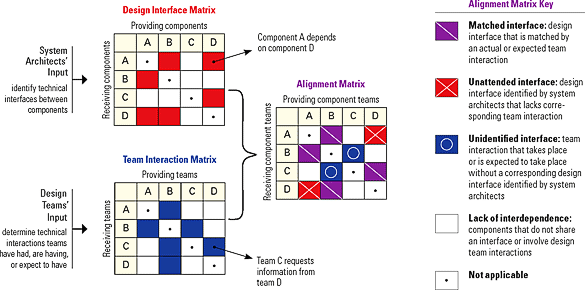
A recently developed new application of DSM is an Alignment Matrix. It was developed in the field of product development to aid managers between different sub-component development teams in identifying key areas where planned communication failures could occur. This was done by overlaying a team-based (team interactions) DSM and a component-based (design interface) DSM. The uncommon areas after overlaying reveal the unattended and unidentified interfaces of technical communication. The thinking behind this application is that every product development project should focus on the certain critical points of contact between development teams.
This application comes under the “performing system analysis” category and will be discussed in this article. It is chosen because of the program management perspective that can be reflected upon, drawing on insights on how projects communicate and coordinate within a program. The product development manager in the below can be seen as or compared to the program manager with the different sub-component development teams as mini-projects under the same program. This statement will become clear by reading the case.
The application elaborated through a case example
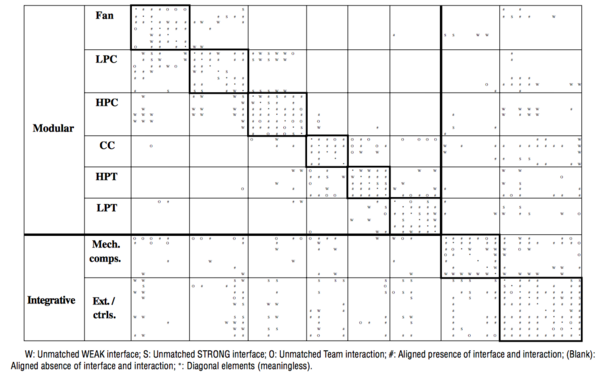
The application of Alignment Matrix was developed during a case study of Pratt and Whitney’s development of the engine PW4098. Like any complex product, the engine was divided into 8 components which were further subdivided into 5 to 10 sub-components. Note that 6 out of the 8 systems were considered modular. That made up a total of 54 component development teams, each having its own design and development team (Sosa et al, 2004; Havard Business Review). Besides these, there were 6 system integration teams who were responsible for the engine as a whole. While each team had to develop their own component, it was also necessary to integrate the designs with that of other components. Sometimes, the links between components were not just physical but involved an exchange of either energy (heat, vibrations) or a media like fuel or air. These links were also critical for engine performance and a bit more difficult to anticipate as they sometimes did not reflect in the product architecture or specifications clearly. Any losses or failures in communication at this stage can be critical to the outcome of the project. For this purpose, the researchers proposed the application of DSMs to map out the situation in order to identify failure possibilities.
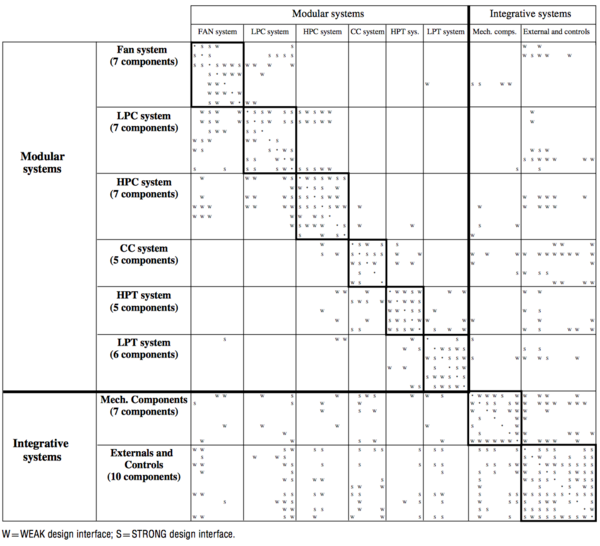
Identifying the design interfaces Researchers started by working with the product architects to identify all the components and the interfaces between them. Theory and concepts in engineering design were applied to identify types of design dependencies which included spatial, material and energy-related as well as various levels of criticality. (Pahl and Beitz 1991, Pimmler and Eppinger 1994, Sosa et al. 2003). These dependencies were mapped in the below design interaction matrix using a two devel dependency frame (strong or weak) .
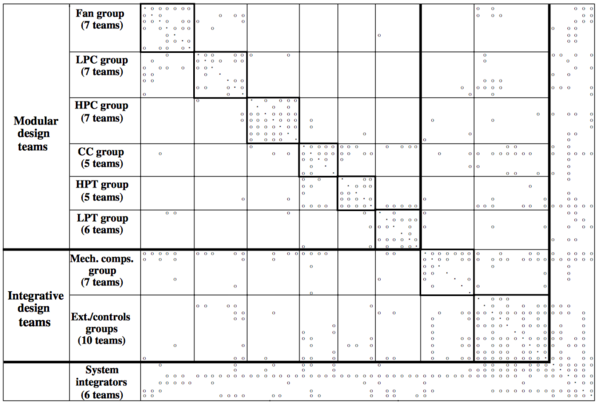
Identifying the team interactions (communication interface) Key members of teams were interviewed for information on parameters like frequency and criticality of technical communications (Allen 1977, Marsden 1990). They were even asked about their anticipation of information from other teams. Note that in this process, teams were not made aware of design matrix in order to avoid biases during analysis. In addition to that, 57 of the 60 teams were surveyed for additional technical communication interactions. Finally, all these interactions were mapped on a binary scale as shown below. Note that the 6 system integration teams are not mapped as they interact with all teams and responsible for the coordination themselves.
Lastly, the two matrices were overlaid to give the following alignment matrix in order to get insights into where planned communication failure could occur.
Some interesting findings from the case. Even though Pratt made efforts to have special Component Requirement Documents (CRD) with the intentions of design optimization and encouraged cross-boundary interactions, there were still 220 (39% of the 569 design interfaces) unmatched design interfaces and 74 (17% of the 423 team interactions) unmatched team interaction. While most of the missed interfaces were not critical, two interfaces, in particular, were. Their costs have varied with time, with one accounting to 1 to 2 percent of development costs and three to four months in project delays. That can be considered as a huge loss for something as small as a communication failure.
Critical reflection
In theory, the application of the tool is pretty straightforward and simple. In practice, however, the above theory translates into massive amounts of data collection in order to be able to fill up the two matrices. Researchers, who developed this tool used interviews and other data collection methods to collect this data. This process can be time-consuming as it involves a lot of data processing in order to carry out accurate mapping.
The study recommends assignment of resources to pay attention to these interfaces. This could also be a role of the program/project management team. Another approach or rather a complementary approach is to have the matrices as live documents which can be updated by all teams. This creates an awareness of the critical data along with knowledge about the communication network and points.
If a program is considered a system, then the projects within the program become the elements of the matrix. The interaction between projects becomes a matter of interest in program management, especially to effectively manage a program. The difference though is that unlike the design interface in product development, the functional interface may be more complex or vague between projects especially in Organizational Change Programs and Societal Programs. These type of projects are also hard to generalize and hence difficult to apply the tool without sufficient investment of resources.
Limitations
Identifying the interfaces can be a challenge especially when you have the cross-functional team with people working in multiple teams or where the organizational structure boundaries are not clearly defined. While the tool is useful in giving key communication failure insights, it does not necessarily benefit the current project, especially when applying it for the first time. Hence, it may not improve the current communication challenges of a project. It, however, does have potential if used actively. Applying the tool can be a tedious task of noting all the departments, identifying interfaces, plotting and so on and will mostly require the time of the system designer which is many cases is the project manager. It is also intensive on resources as it involves lengthy data collection and processing procedures.
Advantages The alignment matrix tool could be a good complementary tool to feedback systems on how effectively the communication system has been designed and implemented. It also helps create an awareness about the vital communication points which could set the path for critical thinking while designing future organizational structures. It also does massively improve communication in similar types of future projects and hence, is worth the resources. A manager can also now compare system architectures of previous systems which can greatly benefit the learning process and eventually designing of better communication management systems and organizational structures.
References
- Applying the Design Structure Matrix to System Decomposition and Integration problems: A Review and New Directions, Browning, T., IEEE Transactions on Engineering Management, Vol.48, No. 3, August 2001.
- The Misalignment of Product Architecture and Organizational Structure in Complex Product Development, Manuel E. Sosa, Steven D. Eppinger, and Craig M. Rowles, Management Science, Vol 50 December 2004, pp. 1674–1689
- Are Are Your Engineers Talking to One Another When They Should?, Manuel E. Sosa, Steven D. Eppinger, and Craig M. Rowles, the article from Harvard Business Review.
- An Introduction to Modeling and Analyzing Complex Product Development Processes Using the Design Structure Matrix (DSM) Method, Ali A. Yassine.
- “Applying the design structure matrix to system decomposition and integration problems: a review and new directions”, T.R Browning
- Engineering Design, A Systematic Approach, Pahl, G., W. Beitz. 1991, Springer-Verlag, New York,
- Integration analysis of product decompositions, Pimmler, T. U., S. D. Eppinger. 1994, Proc. ASME Design Theory Methodology Conf., DE-Vol. 68, 343–351.
- Managing the Flow of Technology, Allen, T. J. 1977, MIT Press, Cambridge, MA
- Network data and measurement, Marsden, P. V. 1990, Ann. Rev. Sociology 16 435-463.
- Identifying modular and integrative systems and their impact on design team interactions, Sosa, M. E., S. D. Eppinger, C. M. Rowles. 2003, J. Mech. Design 125(2) 240–252.
