Fishbone diagram analysis
Developed by Maria Konstantina Papaioannou
Abstract
Risk project management is a broad and complex field. It is well established that every project at every stage carries risk. Possible risks for a running or finished project are countless and may vary from anticipated to unexpected. Besides, their result ranges from minor inconvenience to disruption of the project. Thus, identifying possible risks is a key challenge for every project. Once identified and listed those risks can be categorized using qualitative risk analysis. This article introduces the Ishikawa fishbone diagram as a method to analyze numerous reasons why a project may fail. The diagram provides a visualization that simplifies the identification of risks and categorizes them. It heavily relies on the idea that minor problems matter and can lead to causes that affect badly the existing project. It is commonly used by safety and reliability engineers to detect faults in construction.
Firstly, this article gives a historical overview of Kaoru Ishikawa, who invented and named the diagram. Based on three papers that study and utilize the fishbone diagram on specific cases and the Project management book by Dennis Lock, this article analyzes its basic components and provides detailed guidance to the building of the diagram. Also, it briefly presents its implementation on the Apollo 13 incident. Additionally, the article displays the technique’s benefits and refers to its disadvantages. Finally, it reflects critically on its limitations and makes recommendations on how to maximize the diagram’s utility.
Description of Ishikawa fishbone diagram
Historical overview
Japanese organizational theorist Kaoru Ishikawa(石川 馨)was born in 1915 in Tokyo, Japan, and he is considered a key figure in the development of quality initiatives [1]. During the year 1968, while working as a full-time professor at the Faculty of Engineering at the University of Tokyo, Ishikawa studied the concept of quality and introduced the seven quality management tools for projects’ improvement in his book Guide to Quality Control. In the book, Ishikawa explains thoroughly the concept and the utility of each of the following tools: Ishikawa diagram, the histogram, the Pareto chart, the check sheet, the control chart, the flowchart, and the scatter diagram. The book includes instructions on building and reading the quality control techniques mentioned above . The Ishikawa diagram popularized during 1960 by Ishikawa who implemented quality management processes in the Kawasaki shipyards. The diagram is utilized until today by many organizations as a quality tool and therefore Ishikawa is considered one of the founding fathers of modern management.
Building the diagram
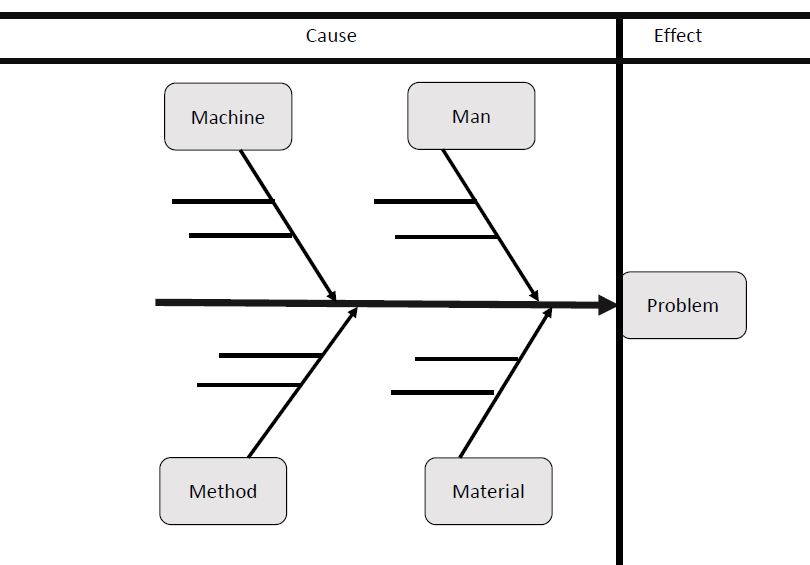
Ishikawa fishbone diagram is a technique that helps users visualize and sort numerous reasons why a project may fail [2]. It combines brainstorming with a concept map. It can be implemented in various kinds of projects such as manufacturing, marketing, and so forth. The Ishikawa diagram is also referred to as a cause-and-effect (CE) diagram because of its function but most commonly it is referred to as the fishbone because of its unique shape. A completed fishbone diagram includes a central "spine" and several branches very similar to the side of a fish skeleton. The head of the fish represents the problem of the project and the causes are connected with its spine that is the x-axis of the diagram.
According to research paper "The application of cause and effect diagram in the oil industry in Iran: The case of four liter oil canning process of Sepahan Oil Company" [3],in order to effectively build the fishbone diagram a group must carry out the steps that are presented below:
Step 1: Group members should brainstorm and agree on potential effects/near misses that might or had already threatened the success of a project. The problem statement will be placed later on the right side of the diagram and will be represented by the head of the fish.
Step 2: Each member should agree on the major categories of causes that lead to the problem. Though it is up to the team to select the causes’ categories, usually depending on the nature of the project, . in a simplified version of the diagram, the categories could be the 4Ms: Machines, Materials, Methods, Manpower.
 ( based on [4])
The causes under each category must be related to[5] :
• Man: Anyone involved with the process. This could mean employees designers, engineers, managers etc.
• Methods: Specific requirements for dealing with the project, such as policies, strategies, procedures, rules, regulations and laws
• Machines: Equipment of any kind utilized during the project such as computers and tools.
• Materials: Materials used to produce the final product.
Although, many specialized work in the fields of Quality Management show different patterns of Ishikawa diagram with most common categories being equipment, process, people, materials, environment, management. The fishbone diagram can be simple or complex according to the number of branches in it.
Error creating thumbnail: /bin/bash: line 1: /usr/bin/convert: No such file or directory Error code: 127 ( based on [6])
Step 3: Identification of causes. This stage is a brainstorming session. Group members are expected to think of potential causes that result in the defect of the project. The causes are organized under the category they are related with and are represented by lines that lean on the x-axis.
Step 4: Identification of sub-causes. Sub-causes are branching off the cause branches. Those are represented by lines parallel to the spine of the fish. By continuous searching of the causes of the problem, the group generates deeper levels of them. It is noteworthy that one cause might match with more than one category. Through those line segments, representation can be simple, but it can become more complex by completing with qualitative and quantitative appreciations and risks that characterize each cause.
Step 5: Interpretation of the diagram and developing solutions to correct the causes and improve the process or product. Once the process is completed there will be numerous identified root causes -most likely too many to solve at once. Thus, at this point, the team will need to select the root causes they wish to initially solve and target effort and resources on them.
The fishbone diagram implemented on the Apollo 13 incident
The key of the technique is that it is very helpful in scoping the problems of a particular project and getting on top of them by identifying the causes. To thoroughly understand the diagram’s utility, a specific example with a problem statement and its causes is presented below. Let us use as an example the Apollo 13 mission. On April 11th, 1970 Apollo 13 was launched from Kennedy Space Center. It was the 7th manned Apollo mission and was supposed to be the third to land on the moon. Approximately 56 hours after takeoff a routine check caused an oxygen tank in the service module to explode turning the moon landing mission into a rescue mission getting the crew safely home. The crew landed safely in the South Pacific Ocean on April 17th and the mission has since been called a successful failure [7]. The problem statement in this mission is the explosion of the oxygen tank. Potential causes of this defect are mainly related to three categories of the 4Ms fishbone diagram:
•Man: Starting at the building of the oxygen tank, the main potential cause of the explosion on behalf of the engineers could be their incompetence. This could mean negligence, lack of training and motivation, or lack of experience while testing the tank. Besides, the crew involved in the mission may have lacked knowledge and data considering the high complexity of space travel.
•Method: The cause of the flawed oxygen tank related to this category could be the poor quality test performed by the engineers on the tank or the poor quality of the tank.
•Material: The cause of the accident related to the category of the materials could be the lack of appropriate tools and devices with an accuracy inadequate to the tolerance.
Τhe entire country focused immense resources and effort to the project of landing on the moon. Therefore, after the incident experts focused their attention on understanding the cause.
The root cause as identified by the experts is that during the maintenance procedures related to Apollo 10, the second oxygen tank was accidentally dropped, damaging the fill connection inside the tank. Thus, the root cause was indeed under the Man category of the fishbone diagram.
Looking back on the Apollo 13 incident after identifying the root causes raises the question: was the project a success? Project and project management success are two concepts that should not be confused. Considering that the mission's initial goal was lunar landing the project cannot be characterized as successful. Although, even if the mission far exceeded its budget, the resilience and improvisation of both the astronauts and the mission control room crew were impressive, and thus the project management was successful. Overall, the Apollo 13 stayed in history as a "successful failure" [6].
Benefits
The fishbone diagram has a long history of over 50 years of use. [8] Managing Quality 5th ed It is one of the original techniques developed to help problem solvers understand the causes of a problem. The benefits of the technique are presented below. The fishbone diagram is a comprehensive and simple visualization of a complex reality. It pictures all the factors that lead to the defect of a project in a structured way. In project management, simple and minimal models are often very popular.
It provides an overview of both primary and underlying causes. Interestingly, in some cases, the most apparent cause turns out to be minor, and causes that were considered unimportant may lead to the defect. This diagram helps the project group emphasize that and allows identifying the root causes which will lead to a long-lasting resolution.
Fishbone diagram has nearly unlimited application. It can be implemented in research, manufacturing, marketing, office operations, and so forth. Because it gives a clear and holistic overview of the project’s potential or existing problems it can have both a reactive and a proactive action. Therefore, by understanding and analyzing the contributing factors of a system failure or a near-miss the project team can avoid it or improve it. Additionally, the diagram may be utilized by both data-oriented and non-analytic companies.
The diagram encourages group participation. The brainstorming process is mainly popular for its democratic nature. Group members have the opportunity to be creative, snowball their way through the problems and give a unique perspective to the identification of the causes and sub-causes.
Limitations
Some of the disadvantages of the fishbone diagram could be related to the nature of brainstorming. Brainstorming to come up with causes and sub-causes is an early stage of the diagram’s building. It can turn out to be an unstructured or even chaotic process. Due to this, during brainstorming, some group members might be outvoiced and the process might be very time-consuming. This means that a great amount of time can be dedicated to this early stage of the building of the diagram and not to the development of the solutions. In addition to that, brainstorming could be considered subjective because it is often based on opinions rather than on factual evidence.
The Ishikawa fishbone diagram might also fail to capture the interrelationships of multiple factors that contribute to the problem statement. Some categories of the diagram can be connected: for instance, the materials could be connected to the people category in the suppliers’ sector.
Finally, in the case of a complex problem statement, the diagram is prone to becoming very complex and thus difficult to interpret.
Recommendations
Fishbone diagram combined with data analytics in data driven companies.
It can be combined with analytics and statistics. By using internal or external data and assigning the data visualizing the results to qualified co-workers, project managers would be in a position to respond to identified weird patterns or trends. For example, in the marketing field data analysis can have a huge impact on a project’s development as it detects customers’ behavior patterns and preferences. Additionally, collecting data of previous similar projects and perform statistical analysis to them answers the question of which problem is more likely to occur based on previous experience. This way, the group can focus mostly on fixing those problems. Since the diagram is related to the uncertainty component of Project Program and Portfolio management, if combined with a risk or safety management model it could provide even better insight into the problem and its solutions.
Fishbone diagram combined with risk management models in order to rank the problems.
Once the effects are identified by the team, as mentioned above, the fishbone diagram offers no guidance as to what to solve first. In this case, the effects could be organized into two categories: existing problems or potential problems. Both of these categories can be ranked according to the severity of the impact that they had/will have on the project and their probability of happening. In the ranking process the risk matrix [6] could be extremely useful. After that, groups should start with dealing with the problems whose consequences would be catastrophic and reaching to problems that have residual risk. This way the fishbone diagram can be implemented multiple times to many problems.
Fishbone diagram combined with components of safety management framework in developing of solutions.
Once the root causes are identified using the fishbone diagram, the solution developing session begins. This session can be combined with the key concepts of the safety management framework. Safety is a legitimate management objective in every project and the safety management framework consists of four key concepts [6]:
a. Top commitment management/Leadership.
b. Redundancy.
c. Operational control.
d. Learning.
In case the root cause for a problem is classified under the Machine category, the solution to this problem might lie in the redundancy concept of the safety framework. Project managers might consider adopting the redundancy approach as a solution. Redundancy is a backup system or else a duplication system. This means that if one component fails, another takes in. It is certainly a proactive approach to problems and the main tool to reduce risk. Redundancy could be applied to causes that contribute most to the identified problem.
If the root cause for a defect in a project lies in the Man category, project managers could apply the operational control concept. This would include training the personnel of the project. Besides, project managers could borrow the leadership, operational control, and learning concepts. Leadership and commitment management can be implemented in the brainstorming process. In order to improve it, there could be a coordinator of the session who makes sure every group member is heard and respected and sets a time limit to it.
Annotated Bibliography
Lock, Dennis ; Project management (2007) p. 100.
The book Project management by Dennis Lock introduces the concept of a project as a temporary endeavor that needs to be successfully completed. The book gives an overview of multiple aspects of project management and has been pre-eminent in its field for many years since it was one of the first books that gives a holistic insight to project management. It refers to the fishbone diagram in chapter 7 "Risk". In chapter 7, the writer introduces the Ishikawa fishbone diagram as a tool to "examine failures or poor performance in organizations". He briefly explains its use and directly links it to the risk assessment process of a project. The book was the ideal source to give a brief explanation on the adaptation of the diagram and the circumstances under which it is used.
Ishikawa, Kaoru (1990); Introduction to Quality Control
The book that introduced the concept of quality and the fishbone diagram is one of seven quality tools is a key reference for this article. Quality control is a system adopted by a company in which all the company members participate, from the top management to the workers in the actual workplace. By this system, Ishikawa introduces an innovative change to business management and established project management principles. In the book, Ishikawa dedicates a chapter describing the use of the diagram in the cause identification problem. In the book, it is also referred to as a cause-and-effect diagram. It provides practicable theories that be used by both academics and practitioners.
Branch, Ardestan ; The application of cause and effect diagram in the oil industry in Iran: The case of four liter oil canning process of Sepahan Oil Company (2011)
The writer of the paper utilizes the fishbone diagram which, as mentioned in the article, is not used for quantitive analysis rather than qualitative. He also uses the six sigmas tool that is suitable for data-driven methodology for identifying the root cause of a problem. By combining these two tools, the writer performs a thorough analysis of the problem of the production line problem of Sepahan Oil Company. The paper gives detailed instructions on how to build the fishbone diagram and a brief historical overview. It is an appropriate source since it refers to other quality management tools as well, such as the Pareto chart, giving an overview of how quality management relates to the risk identification stage of a project.
References
- ↑ "Guide to Quality Control. Tokyo: Asian Productivity Organization "
- ↑ "Lock, Dennis ; Project management"
- ↑ "The application of cause and effect diagram in the oil industry in Iran: The case of four liter oil canning process of Sepahan Oil Company "
- ↑ " A new model of Ishikawa diagram for quality assessment"
- ↑ "A new model of Ishikawa diagram for quality assessment"
- ↑ 6.0 6.1 6.2 6.3 "The application of cause and effect diagram in the oil
industry in Iran: The case of four liter oil canning process of Sepahan Oil Company " Cite error: Invalid
<ref>tag; name "foo" defined multiple times with different content - ↑ "Wiki, Apollo 13"
- ↑ "Managing Quality 5th ed"
Ishikawa, Kaoru (1990); Introduction to Quality Control
Dale, Barrie G. et al. (2007); Managing Quality 5th ed
Branch, Ardestan ; The application of cause and effect diagram in the oil industry in Iran: The case of four liter oil canning process of Sepahan Oil Company (2011)
url: http://www.academicjournals.org/app/webroot/article/article1380537568_Hekmatpanah.pdf
Hedlund, Frank ; Course 02431 Compendium (2021)
Wiki; Apollo 13 ;
Luca, Liliana ; A new model of Ishikawa diagram for quality assessment (2016)
url: https://iopscience.iop.org/article/10.1088/1757-899X/161/1/012099/pdf