Network Planning in Project Management
Contents |
Abstract
Planning is a big part of project management, and the success of a project is highly dependent on the planning process. The method, Network planning, can be used to reduce complexity of a project and smoothen the execution of the project planning. A project of a large scale that require coordination of multiple activities is a challenging task for a project manager. Succeeding a project is about simple forms of working and organizing regardless of the size of the project [1]. The method will therefore be used as an integration approach where the different activities are separated to get an overview of the process. Understanding the dependencies of the project and setting up millstones is also ideal to motivate the employees involved with the project.
Project networking is to investigate a project as sets of interconnected activities with the purpose of assisting in planning, managing, and controlling projects [2]. This article will mainly focus on the most well known network planning techniques: the Critical path method (CPM) and the Program evaluation and review technique (PERT). CPM and PERT was developed in the 1950’s and have since then been used widely in operation research and project planning [3]. The goal of the tool is to manage a project, meeting its deadlines with a minimum total cost. The tools will help to organize the project, getting an overview of the activities and estimate the total length of the project. There can be multiple paths to the end of a project, but the tools presented in this article can help the manager find the path(s) with the longest duration that need the most attention in order to complete the project within the estimated time frame. Initially the methods will need three types of information to describe the project: activity, precedence, and time [3]. This will be elaborated in the article followed by a description of the tool, an example of how to use the tool, other alternative planning tools and the limitations of the tool. It is based on a project managers point of view and what that person may consider when planning a project.
Introduction
In order to manage the complexity of a socio-technical system, such as a project, it is important to consider the following three steps: separating, integrating and adapting [1]. Running a project can be overwhelming and no person is specialised in every little step, therefore it is important to divide the project into different activities. It is then essential for the project that these activities complement each other and contributes to the overall purpose of the project. Lastly the project needs to continuously evolve and respond to changes. The goal of every project is a smooth project execution where deadlines are met, rework is avoided, and every person involved is engaged in the success [1]. To meet these goals and increase the effectiveness, the planning of the project must be executed with high priority and professionalism. Network planning is a tool used in project, program and portfolio management in the planning process. The tool is great to give an overview and coordinate the activities in the given project in order to help project managers. Today it is set up as a software package to deal with the data and progress of the project. The two tools that will be described and elaborated in this article are the Critical Path Method (CPM) and the Program Evaluation and Review technique (PERT), which originally were independently developed, but today widely used as two tools merged into one [3]. The tools work great together, combining the techniques from both. In general network planning studies many different kinds of problems such as project scheduling, risk analysis, cost minimization or Net Present Value maximization, [2] which all depend on information that is needed from the project manager. Any delay within a project results in increased costs, which should be avoided [1].
The method is supported by the ISO 25000 standards that suggest three main processes for developing the schedule after identifying the activities. First step is sequence activities, then estimate activity duration and develop schedule [1]. In order to use those steps in network theory for planning a project and using the CPM/PERT method, they are set up in the following way. First, activity information is required, meaning that the project must be broken down into individual activities. Secondly, the precedence relationships are required, meaning that the immediate predecessor(s) for each activity is found. Finally, the time information is required, meaning that the duration of each activity must be estimated. The project network should convey this information so that the project manager can describe the project and make the schedule [3]. The estimation technique that is used is similar to a bottom-up estimate, which is the opposite of the top-down estimate. A bottom-up estimate focuses on estimating the duration of each activity before combining them all into the overall estimate of the project [4].
Network Theory
The first section will present the terminology of network planning where two important definitions are described for a better understanding of the method.
Graph Theory
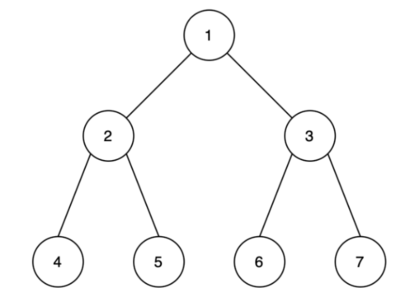
A graph that consists of multiple nodes and arcs, is considered a network. This means that a network consists of nodes that are connected through arcs. In this article the exploration of networks will be centered around project planning, which means that the nodes correspond to the events in the project. The arcs correspond to the connection between the activities and can either be directed or undirected. When an arc is directed, for example from A to B, it means that the network can only go from A to B and not from B to A. An example of a network with undirected arcs is illustrated below.
Spanning Tree
Consider a network with a number of nodes n and no initial arcs. By adding one arc at a time between the nodes, a tree will appear. The first arc can be between any of the nodes in the network, but along the way, an arc cannot be placed if it creates a cycle. A network of nodes connected through arcs is referred to as a spanning tree. A network therefore differs between being cyclic or acyclic and a spanning tree is acyclic.
A network will always have one or more start node(s) and finish node(s). A project network can be split into two, depending on whether the activity is on the node or on the arc[5]. Those two types are referred to as Activity-on-arc (AOA) and Activity-on-node (AON). For the AOA, the node is separating the activities and therefore the arcs show the precedence relationship between the activities on the nodes. The AON is used in the CPM/PERT method, since it is simpler to construct, understand and revise than the AOA. As the name refers, the activity is on the node and the arcs only show the predecessors relationship. Except from the start node, a node will always have one incoming arc for each of the immediate predecessors, but multiple incoming arcs if the node has more than one. This article will from now on only focus on AON [3].
CPM/PERT
The CPM/PERT method is an ideal method to get an overview of a project planning process and helps answering multiple questions that a project manager may have for the process. The procedure described in this section is from [3]. The method is a combination of the two well known operation research techniques CPM and the PERT. The PERT will graphically visualize the project timeline with all the individual tasks from start to completion of the project. It is used to estimate the duration of each activity, evaluating the time that is needed in order to complete the project within the scope of the projects lifetime. The method uses the network terminology, where activities are visualized as nodes and arcs describing the precedence relationship between the activities indicating the flow of the project [6].
The critical path can answer how much time the project will take to complete and what the bottlenecks are to be aware of in order to prevent delays in the project. The CPM will establish the time length of the project, summing over all the durations of the activities. In a project network from a starting node to an end node, multiple paths can be set up if the activities can be done in sequence with a predecessor and no overlap. Therefore some activities have to wait for other activities to finish before it can start. Those can be activities that are on another path. The path with the longest total duration time is the critical path and therefore the longest duration time that the project can take assuming no delays occur. This is also the bottleneck activities of the project where delays must be avoided so that the whole project can be completed in time. The activities in the critical path deserves the most attention, since they are important for the project.
Scheduling the project
Earliest start- and finish time
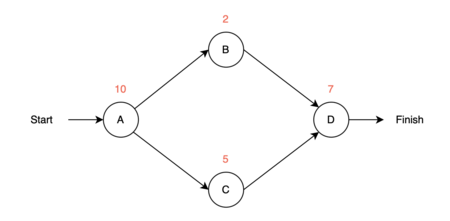
The next question that the the project manager may ask is, when all the individual activities at earliest can start and finish? The first step of the procedure is to address when every activity in the process can start and end if no delays occur. Those are defined as earliest starting time (ES) and earliest finish time (EF), where EF is equal to ES added to the estimated duration of the given activity. For convenience, the times are estimated in time periods instead of dates. This article will be based on weeks, but it could also be months or years. A small example is illustrated in figure 2.
Identification of ES
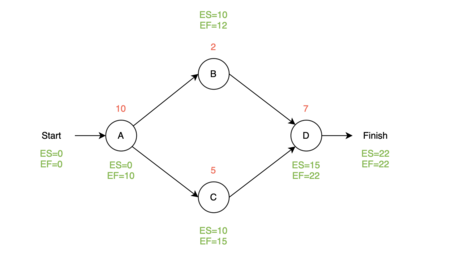
The first activity will always start at time period 0. Let us call the first activity A with a duration of 10 weeks. Then ES_A=0 and EF_A=0+10=10. For the next two nodes, let us call them B and C with duration 2 and 5 weeks, then ES_B=10 and EF_B=10+2=12 and ES_C=10 and EF_C=10+5=15. For the last node/activity of this small example, let us call it D with a duration of 7 weeks, the activity will have 2 predecessors and cannot start before both of them are done. Therefore the earliest starting time for C will be 15 weeks instead of 12. This means that ES_D=15 and EF_D=15+7=22. Now ES and EF are known for all nodes. The small example is illustrated in figure 3. If a node/activity has a single predecessor, then ES for the activity is equal to EF for the predecessor. If the activity has two predecessors then ES is equal to the latest finished predecessors ES. In figure 2 the small example from before is visualized with ES and EF. Notice that this example has two possible paths where the first one has a total time length of 19 weeks and the second one has a total time length of 22 weeks.


Since the second path has the longest duration, this is the critical path.
Latest start- and finish time
Another question the project manager could ask, is how much the individual activities can be delayed before the whole project is delayed. To answer this question the next step is to calculate the latest start time (LS) and the latest finish time (LF) for every activity, where LS is equal to LF with the estimated duration of the given activity subtracted. The times are still based on time periods, for example weeks.
Identification of LF
When those parameters are estimated the procedure is to start backwards in the network. The method assumes that an activity's successors cannot start before the given activity is done.
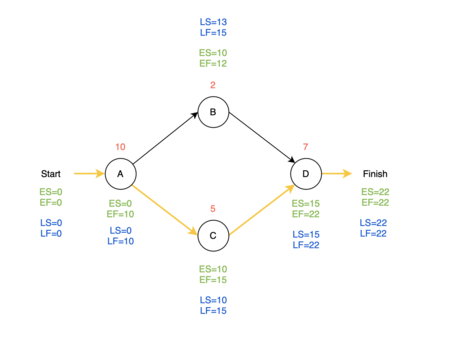
For the finish node, LF will always be equal to ES, so that the project is still completed within the estimated time frame. LS is then equal to LF the duration time subtracted, which is 0 for the finish node. The explanation of how to find LS and LF will again be used on the small example from earlier. This means that the next step is to find LS and LF for activity D, LF_D=22 and LS_D=22-7=15. This continues for the rest of the nodes until Start. Node A has two successors and therefore LF is equal to the lowest value of the B and C's LS, which is 10 instead of 13. All the blue values indicate the last possible chance for an activity to finish before the whole project will be delayed. The values are visualized together with the critical path in figure 4.
Slack in the schedule
It is noticeable that node B is the only node with a different LS and LF value compared to the ES and EF value. To understand what this means for the project, slack is investigated in the schedule. The slack is calculated using LF and EF for each activity:

Calculating the slack for all 4 nodes, the only node with a slack different from 0 is B.

This means that activity B can be delayed with up to 3 weeks and the project will still be completed within the estimated time frame of 22 weeks. This also means that the nodes A, C and D with a slack value of 0 cannot be delayed without delaying the whole project. Those nodes are therefore also forming the critical path, which is illustrated with a yellow line in figure 4. This is how the PERT/CPM method identifies the critical path.
Limitations
The PERT/CPM method has answered the questions that were presented in this article, but there are some limitations to be aware of. The method is great to visualise the small examples, but it will be difficult to use it with large complex projects where the time estimations and predecessors are harder to identify. It can become a time consuming task to draw up the diagram and make the scheduling calculations for every activity. To solve this on larger problems, you may have to use linear programming, but that can also be complex and time consuming to set up.
The method is based on estimations, which may have to be revisited once the activities are scheduled and the critical path is identified. If the critical path is estimated to have a completion date later than what is required, the estimations may need to be adjusted [1]. This results in an increasing uncertainty of the estimations. In case this should happen, the estimation process would change to a top-down estimation. This type of estimation is often connected to more uncertainty since the activities no longer are being assessed individually. Generally bottom-up estimates tend to be more accurate than top-down estimates but are more time consuming [4].
The CPM/PERT method is simple to use, but not focused on any resources involved in the project. This causes a lot of inflexibility for the process and may not work on long-term projects. Other than that, the method is not taking adaptation into account, regarding the three steps (separating, integrating and adapting), which is a big part of project management. The method is flexible for any changes that may affect the project unexpectedly. Should any major changes happen, the process would have to start all over. Separating and integrating the project is a balance, because the more you separate, the more you need to integrate. Choosing the right level of separation and integration is central to managing the complexity of a project.
This article is narrowed down to only looking at the time aspect of project network planning, but there is more of the tool to investigate. The method may be expanded to uncertainty and costs which are important aspects of project planning. The CPM/PERT method uses accurate estimations of activity duration, which is associated with uncertainty and it is therefore relevant for the project manager to know what the probability is to meet the deadlines. The uncertainty is then expanded to include time-cost trade-offs. So, whether it is possible to decrease uncertainty with increased cost. This part of the method will not be further investigated in this article, but is presented in the Annotated Bibliography.
Taking the limitations of the tool into account, the PERT/CPM is still one of the most widely used operations research techniques within project planning [3] . Even though the tool does not answer all the questions that a project manager may have, the answers that it does give are very useful, and many workstations already have the software package installed in order to use this tool. This tool is applicable for many projects even though other great project planning tools are available too.
Alternative planning tools
Multiple planning tools are widely used in project, program and portfolio management. Given the scope of the project, some tools are more relevant than others. Other examples of project planning tools are Gantt Charts and Milestone Planning. Just like the CPM/PERT method, the Gantt Charts is a graphical description of a projects timeline and used in the same way as the PERT alone. Where the CPM/PERT display the activities as a network, the Gantt Charts display it as a bar chart. The critical path can also be identified using the Gantt Charts, making the two methods very similar. Some project managers think that the Gantt Charts is easier to include resources in, which the CPM/PERT does not include. Using the Gantt Charts it is possible to follow how the resources are utilised, making it a great alternative to CPM/PERT. Another possible planning tool is Milestone Planning, where it is also possible to implement the CPM. The Milestone Planning method is a great reactive tool to evaluate on the progress of the project. At the same time, this tool is more simple than the CPM/PERT and could therefore be easier to use on larger projects. Which tool to choose is highly dependent on preferences and the complexity of the project. It is important to notice that all the project planning tools are intended to reduce the complexity of a project and it is therefore important to choose the correct tool so that it does not have the opposite effect.
Annotated Bibliography
This list provides additional resources/information that can be explored for further research and study of Network Planning for Project, Program and Portfolio Management.
F. S. Hillier & G. J. Lieberman. (2015). Introduction to Operation Research [3]
- Since this article is narrowed down only looking at the time aspect of project network planning, there is more of the tool to investigate. The CPM/PERT may be expanded to uncertainty and costs which are also important aspects of project planning. F. S. Hillier & G. J. Lieberman elaborate the expansion of the method including uncertainty and costs in chapter 22. It provides a detailed explanation based on the theory that is already provided in this article.
D. G. Briggs. (2017). Comparison between Deterministic and Stochastic Time Estimating Techniques. [7]
- This article is focused on the comparison between the CPM and PERT, with a different point of view of the method. The article distinguish between deterministic and stochastic estimation techniques and has analyzed the approaches. The conclusion is that the CPM should be used in situations where the activity times are predictable while the PERT techniques should be used in situations where the activity times are unpredictable.
I. L. Cabañas. (2021). PERT [8]
- The article presented by L. C. Ignacio is about PERT exclusively and includes the possibility of risks associated with the estimations. The model presented in the article calculates the weighted average using an optimistic and pessimistic approach. It gives a different perspective of the model compared to this article and is an example of how this method can be applied using different factors and different levels of detail.
D. Simchi-Levi, X. Chen, J. Bramel (2014). Logic of logistic, pp. 379-402. 3. edition. [9]
- Another interesting angle to this subject is how to apply it within supply chain design. The chapter focuses on the issues regarding network planning within supply chain design and planning that are not dealt with in traditional operation research analysis. The chapter gives a comprehensive description of how the network design determines the physical configuration and infrastructure of the supply chain.
References
- ↑ 1.0 1.1 1.2 1.3 1.4 1.5 J. Geraldi, C. Thuesen, & J. Oehmen. (2017). Doing Projects - Nordic flavour to managing projects.
- ↑ 2.0 2.1 G. K. Rand. & L. V. Tavares. (2005). Network Planning: Encyclopedia of Operations Research and Management Science.
- ↑ 3.0 3.1 3.2 3.3 3.4 3.5 3.6 3.7 F. S. Hillier & G. J. Lieberman. (2015). Introduction to Operation Research.
- ↑ 4.0 4.1 J. Everitt. (2022). How to Leverage Project Estimation Techniques. https://www.wrike.com/blog/project-estimation-techniques/, viewed 8/5-2023
- ↑ A. Shaddra. Project Scheduling and Network Planning (With Diagram). https://www.yourarticlelibrary.com/project-management/project-scheduling-and-network-planning-with-diagram/95024, viewed 9/4-2023
- ↑ C.M. Kopp. Program Evaluation Review Technique (PERT) Chart Explained).https://www.investopedia.com/terms/p/pert-chart.asp, viewed 8/5-2023
- ↑ D. G. Briggs. (2017). Comparison between Deterministic and Stochastic Time Estimating Techniques. http://www.ijarset.com/upload/2017/july/21-IJARSET-daketima.pdf
- ↑ I. L. Cabañas. (2021). PERT. http://wiki.doing-projects.org/index.php/PERT, viewed 8/5-2023
- ↑ D. Simchi-Levi, X. Chen, J. Bramel (2014). Logic of logistic, pp. 379-402. 3. edition. https://link-springer-com.proxy.findit.cvt.dk/book/10.1007/978-1-4614-9149-1


