Poyber
Contents |
Competency Matrix - Abstract
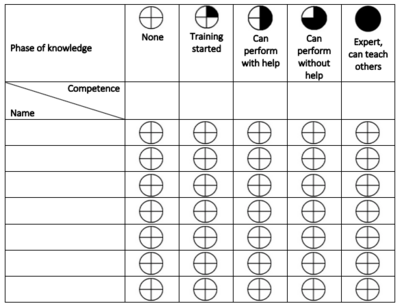
A competency matrix is a tool used to map the different desired competencies of the employees in a team, project or organization. The tool visualizes and gives a comprehensive overview of what competencies each employee has, the competencies the team/project has, and it also identifies who lacks the training to achieve more competencies write [1] . An example of how a competency matrix can look like can be seen at the table below:
Gantt Chart - Abstract
A Gantt chart is a project management tool used for organizing, planning, scheduling, and monitoring of projects and events. The Gantt chart breaks down projects to minor tasks/activities that are shown as a horizontal bar chart with a start and end date. Furthermore, the Gantt chart also shows dependencies (among activities), if activities overlap, scheduling, deadlines, who the activity should be performed by, resources needed, cost of activity, etc. It illustrates and creates an overview of the progress/phase of the project and gives information related to time, costs, and resources (planned and actual) [2] . An example of a very simple Gantt chart can be seen below:
Problem Tree Analysis
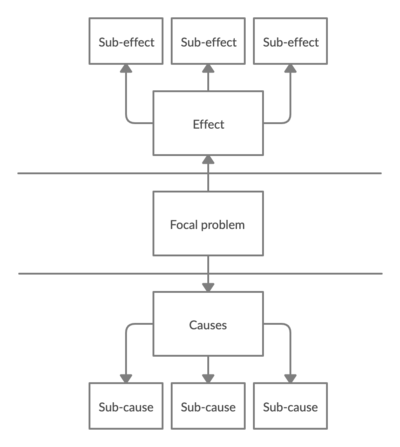
The problem tree analysis is a visual representation of a problem and its causes and effects. It is effectively used with broad issues where the consequences and root causes are not fully known. Since it enables breaking down a problem into manageable parts as well as generating discussions and sharing new views on a topic. The first step when creating a problem tree is to identify an issue to be analyzed, the “focal problem”. Thereafter the causes and effects are identified and placed out on either the top or bottom [3].
Standardized work - LEAN
Standardized work is a part of LEAN production that is performed to define and document what should be done, by who and when. The work sequences of a process are carefully studied when performed by employees and a takt time is decided. The purpose of the method is to communicate precisely how workers should perform so that variations in production are reduced while aiming for optimal effectiveness and efficiency. Important to remember is that standardized work is not static, but a continuous process that can be improved at any time. [4]
Managing multiple projects
Managing multiple projects require several actions. Making integrated plans for the execution of the projects and making schedules to get an overview of the different deadlines and milestones, are criteria for successful project management. Several managing software can be used to get an overview of multiple projects and ensure no overlaps. It is important to delegate the projects so the workload is reasonable. When managing multiple projects, a manager should prioritize the tasks in an urgent to non-urgent scale, to get a sense of what to focus on at the given time. Continuous communication is the key to successfully manage multiple projects. [5]
A3 Problem-Solving
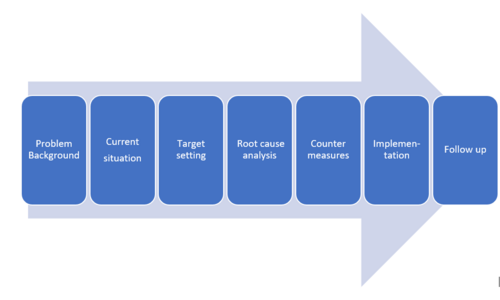
When evaluating projects today you often use metrics as measurements for defining whether a project has been executed successfully or not. When a project is defined as not successfully often an important KPI has not been meet with the expected performance. An example could be time, cost or quality. When evaluating a project, it is important to find out, why we couldn’t meet the expectations. An A3 tool is a tool for making a root cause analysis, to find out why the outcome was not as expected. The A3 allows a systematic approach to find the actual cause of the problem and eliminate the possibility for the problem to happen again. The method is based on a systematical step approach, which is illustrated in the figure. [6]
Risk assessment
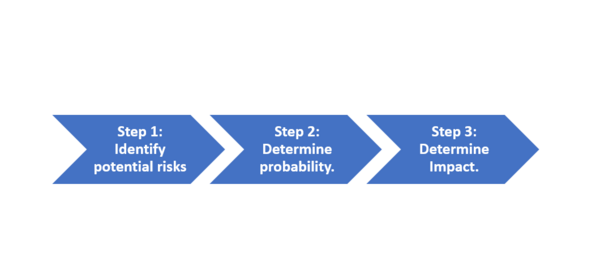
Managing complex projects today is often related to managing uncertainties. Risk is an assessment of a possible event that can have either a positive or negative effect on the project. The key purpose of assessing the possible risk in a project is to ensure that if a possible identified risk occurs then we have had the opportunity to plan how to manage the situation. When making the preparation for possible risk management we can take a 3-step approach for assessing the project risk. [7]
KPI
KPI stands for Key Performance Indicator and is a term for a Lean method that can help a department, or an organization evaluate how well their goals are achieved. KPI’s provide information about how the department performs in relation to its goals and as well where there is room for improvement and development. It’s important that a KPI reflects the actual performance while giving the employee or group an opportunity to influence their KPI’s. When the KPI’s are used properly, they can create motivation and great job satisfaction in a department. It strengthens the collective unity and prepares the employees for when the next challenges must be faced. It’s important that the KPI’s are measurable and dynamic. [8]
Bottleneck identification – Value Stream Mapping
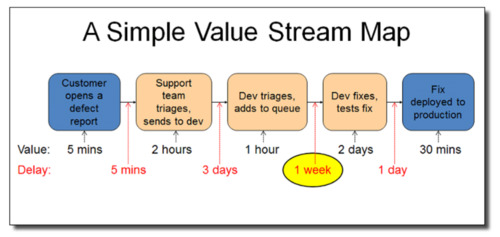
Value Stream Mapping (VSM) is a tool to identify bottlenecks, waste and wherein the value stream there are opportunities for improvement. The create a VSM for i.e. a production, the entire process must be identified. To keep the VSM simple and easy to create the process steps should only be the most generic steps, to avoid the unusual productions. Thereafter data must be collected from the entire process, and the steps in between. Here data such as process time and waiting time must be collected. Now the whole process should be mapped step by step, for example in a flow diagram. Each step in the flow diagram will be assigned a value – which in a VSM describes the time it takes for each step to finish. This is the actual value process time. The delay time must also be registered in the process flow, now the longest delay can be located. [9]
Success Factors
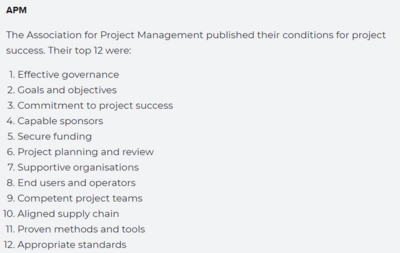
It is a tool to help project managers understand the project which they are doing and ensuring they follow some ground rules for a good project. Success factors tool is often divided into 12 steps, these steps can be viewed as a framework for a successful project. The project manager can go through the 12 steps to see how well the project is doing. [10] [11]
Notes
- ↑ "APM"
- ↑ "AIHR Analytics"
- ↑ Successful Communication - A Toolkit for Researchers and Civil Society Organisations, A report from the "Overseas Development Institute"
- ↑ Article in "schmula.com"
- ↑ Article in "Wrike.com"
- ↑ "kanbanize.com"
- ↑ "www.wrike.com"
- ↑ "KPI - Key Performance Indicators"
- ↑ "IBM"
- ↑ "Wiki Success factors"
- ↑ "Critical success factors"
