Resource-Constrained Critical Path Method
Developed by Giorgia Scartozzi
This article aims to describe a new approach to a specific project management technique called Critical Path Method (CPM).
According to Project Management Body of Knowledge (PMBOK), CPM is a method used to estimate the minimum project duration and determine the amount of scheduling flexibility on the logical network paths within the schedule model[1]. Given scheduled activities for a project that need to be completed in a specific order, multiple task sequences can be defined. CPM helps us to determine the longest sequence of tasks in the project, which will be also the shorter possible project duration. Thus, through a specific example, the main steps of CPM will be described, providing a brief guidance on how to apply the method so to obtain the optimal project duration.
However, a traditional CPM schedule is not realistic, because it assumes unlimited resources, some of which are highly limited in practice[2]. Therefore, a different approach of the same technique, called Resource-constrained Critical Path Method (RCPM), will be presented. By providing a step-by-step RCPM procedure applied to another example, the article will focus on the advantages that this method can offer compared to the traditional Critical Path Method. The paper will then conclude with observations about the benefits and limitations of both CPM and RCPM, highlighting differences and similarities between the two techniques.
Contents |
Overview
What is Project Management?
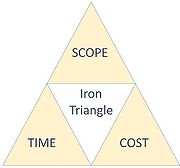
The definition of 'project' can be found in the Project Management Body of Knowledge: it is a temporary endeavor undertaken to create a unique product, service, or result[1]. Ergo, a project is any series of activities and tasks having a specific objective to be completed within some specifications[3], such as start and end dates, specific goals and limits, established implementers responsibilities, budget and schedule[4].The management of a project can be defined as the application of knowledge, skills, tools, and techniques to project activities to meet the project requirements[1]. Its success can be measured through the "iron triangle" model that includes time, scope, and cost (Figure 1). The success of a project should, therefore, be measured within project scope, scheduling, cost, quality, resource, and risk constraints in term of completing the project [5].
Scheduling is an important and difficult task during project planning since it helps to monitor the project duration and resource utilization. The challenge is about the scheduling complexity and dynamism: in fact, plans can change before the start but even during the implementation[4]. In order to better manage projects and face the changes that may occur over time, a lot of methods were created, and among them, the Critical Path Method (CPM) is one of the better-known planning and control techniques in project scheduling.
The Critical Path Method
Proposed for the first time in 1956 during a collaboration between Morgan R. Walker (DuPont) and James E. Kelley Jr (Remington Rand), the Critical Path Method is a deterministic technique developed with the purpose of planning, managing, organizing and analyzing the total time involved in a project. The method attempts to establish the trade-off between the overall cost of the project and the total time for the completion of desired activities[6].
To perform this technique, it is fundamental the use of a network diagram to show logical relationships between the activities of a project, usually represented by arrows (activities) and nodes (beginning and end of the activities). CPM identifies the critical and non-critical paths on this precedence-relationship network, enabling managers to be more focused on those critical activities that can assure the project completion by the deadline. Minimum project duration can be estimated by using this algorithm, that can also provide parameters of activities including earliest starting time (ES), latest starting time (LS), earliest finish time (EF), latest finish time (LF), maximum available time and slack time, or total float[3].
In this regard, we can define:
- Earliest starting time (ES): the earliest time at which the task can start, given that its precedent tasks must be completed first;
- Earliest finish time (EF): the earliest start time for the task plus the time required to complete the task;
- Latest finish time (LF): the latest time at which the task can be completed without delaying the project;
- Latest starting time (LS): the latest finish time minus the time required to complete the task.
Moreover, two important concepts need to be explained: the total float and the free float. According to the PMBOK, the total float is the amount of time that a schedule activity can be delayed or extended from its early start date without delaying the project finish date or violating a schedule constraint, whereas the free float is the amount of time that a schedule activity can be delayed without delaying the early start date of any successor or violating a schedule constraint[1]. The monitoring on these two floats is an important task for a project manager because they indicate the activities in the project that most constrain the schedule[7].
How to use the Critical Path Method
The Critical Path Method comprises several steps, but they can be summarized in three main phases:
- Drawing the network diagram to show the existing relationships between activities to be performed in the project;
- Estimating time involved in each activity;
- Actual scheduling, checking the dependencies among activities and taking into account both necessary resources and available resources;
Step 1: The Network Diagram

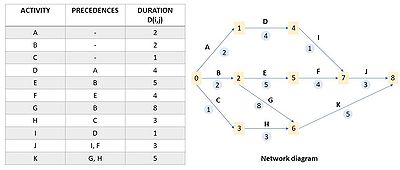
The first step in CPM is constructing an arrow diagram that can show the precedence relationships among the project tasks.
Generally, it starts by making a list of all the activities to be performed in the project, a list of the precedencies and the relative duration. Based on this information, the network diagram can be constructed. As it can be seen in Figure 2, each arrow (capital letter) represents an activity; arrowheads show the order of each task. A node (number) indicates the beginning and the end of the activity, also called events; circled numbers stand for the duration of the activities.
The construction basically follows four rules[7]:
- Each activity is represented by one arrow in the network;
- "Dummy" activities (dotted arrows) are created whenever needed to portray the logic of the relationship between activities. A dummy activity represents an activity which takes no time and uses no resources (Figure 3);
- Two activities shouldn't be identified by the same beginning event and by the same end event.
- The following questions must be answered as each activity is added to the network, to ensure the network correctness:
- What activities must be completed immediately before this activity can start?
- What activities must follow this activity?
By applying these rules, the precedence-relationship diagram can be designed, and it will represent the master plan or working model of the entire project[8].
Step 2: Time Estimation
The second step involves the calculation of the start and finish times for each activity. Considering the durations shown in the previous list and the network that resulted from it, the earliest time event (ETE) and the latest time event (LTE) can be determined. The calculations of these times constitute, respectively, the forward pass and the backward pass.
In the forward pass, computation begins from the start node and continues until the end node. For event 1, it is assumed that the ETE is equal to 0. Supposing that for an event i ETE(i) is known, ETE(j) for the event j can be calculated with
- ETE(j) = max [ETE(i) + D(i, j)]
This calculation can be done for all the activities in the diagram. As an example from the network diagram:
- ETE(6) = max [1+3, 2+8] = 10.
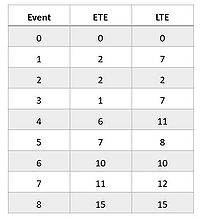
It is conventional to define the project time as the earliest time event of the end event; in this case, the project time is the minimum amount of time needed to finish the project[7]. The ETE for each event can be found listed in the second column of Figure 4.
In the backward pass, instead, the LTE of the end event is set equal to the project time (which in the example is equal to 15). Thus, LTE(i) represents the latest time event i may occur, with the condition that the project time is still met[7]. Supposing that for an event j succeding an event i LTE(j) is known, LTE(i) for the event i can be calculated with
- LTE(i) = min [LTE(j) - D(i, j)]
As an example from the network diagram, since ETE(8) = LTE(8) = 15, there will be:
- LTE(6) = min [15 - 5] = 10
- LTE(7) = min [ 15 - 3] = 12
The LTE for each event can be found listed in the third column of Figure 4. After completing the forward and backward passes, it is possible to determine the earliest starting time ES, latest starting time LS, earliest finish time EF, latest finish time LF, and float times for each activity.
By convention, ES(i, j) = 0 for any activity that has no precedencies, and LF(i, j) = project time for any activity that has no successors. ES(i, j) = ETE(i) because the activity (i, j) may begin as soon as all of its precedencies are completed, and LF(i, j) = LTE(j) because the activity (i, j) must finish before event j occurs[7]. Given these premises, EF(i,j) and LS(i,j) for each activity can be calculated with
- EF(i, j) = ES(i, j) + D(i, j) = ETE(i) + D(i, j)
- LS(i, j) = LF(i, j) - D(i, j) = LTE(j) - D(i, j)
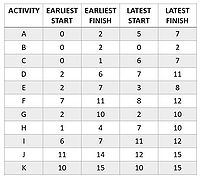
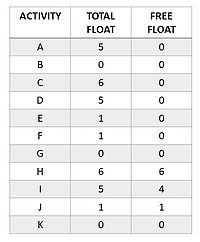
The times for each activity can be found listed in Figure 5. Figure 6 shows the total floats TF and the free floats FF for each activity, and they can be calculated with
- TF(i, j) = LTE(j) - ETE(i) - D(i, j) = LS(i, j) - ES(i, j)
- FF(i, j) = ETE(j) - ETE(i) - D(i, j) = ETE(j) - EF(i, j)
If an activity in the network has minimal total float over all activities, then it's said to be critical. In the normal case, where the project time is chosen as the earliest possible finish time of the project, this activity has zero total float, whereas all other activities are noncritical. A critical path through the network diagram consists entirely of critical activities[7], that add up to the maximum duration of the project completion.
In the network diagram example, the critical path is composed of all the activities with total float equal to zero, which are activity B, activity G and activity K. In fact, the maximum duration of the project completion resulting from this path is
- 2 (B) + 8 (G) + 5 (K) = 15.
Step 3: Scheduling
The third step is about constructing a time chart that can display start and finish times for each activity and the associated floats. It may also show the relationships between activities, therefore presenting a possible project schedule. A schedule is possible in the sense that, if available resources are unlimited, the project could be completed at the scheduled time[7].
After plotting a time chart, it is also important a continuous monitoring and updating of both the plan and the schedule in order to better control the overall project[8].
The Resource-constrained Critical Path Method
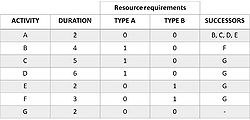
So far, it has been explained briefly how to apply Critical Path Method to a project with specific tasks. However, the basic assumption of the CPM is that the resources required by the activities are unlimited, while some resources are highly limited in practice. Few studies have proposed heuristic algorithms to identify floats and the critical path by using resource-constrained scheduling (RCS) techniques[2]. These traditional RCS techniques successfully generate resource-constrained schedules, in which all activities can be executed without resource constraints. However, they do not provide correct float data and the critical path of the schedules, since they don't consider the resource dependencies[9].
Therefore, this article proposes a new approach developed by combining CPM and RCS techniques, namely the Resource-constrained Critical Path Method (RCPM). The RCPM algorithm is composed of five steps:
- Using the CPM technique, applying forward and backward passes and assuming unlimited resources;
- Applying a serial RCS technique in order to make resource links if an activity is delayed due to resource constraints;
- Applying the backward pass with technological and resource links to calculate late start and finish times;
- Finding unidentified resource links;
- Finding alternative schedules in order to provide more flexibility[2].
Step 1: The CPM technique
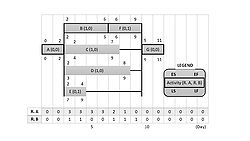
Based on the steps described earlier, the Critical Path Method can be performed in order to find the earliest and latest times of each activity of a project. These can be found written in Figure 8 around the activity (follow the legend). Moreover, the total float can be calculated by using the formula explained before in this article.
Step 2: The RCS technique - forward pass
Having the CPM results of the first step, it is possible to apply an RCS technique. During this process, the activity that is currently being evaluated in the process is named as current activity. If there are enough resources, the current activity can be scheduled at its earliest possible time according to relationships with precedent activities. However, if there are not enough resources for the current activity, it should be delayed until it acquires available resources. After being delayed, the current activity is to encounter a certain date from which enough resources are available throughout its whole duration.
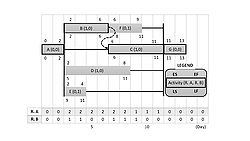
At this point, one or more resource links can be created between the current activity and all or some of the just-completed activities whose time extension directly affects the start time of the current activity due to a resource limit. Once resource links are created, any time extension of the predecessor will delay the start time of the current activity[2].
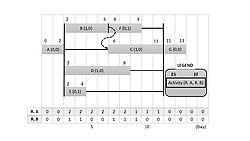
As a result (Figure 9), resource links are created and the scheduled start and end times of the activity automatically become ES and EF, and since this step can be described as a forward step, it is necessary to apply a backward step in order to identify LS and LF.
Step 3: The RCS technique - backward pass
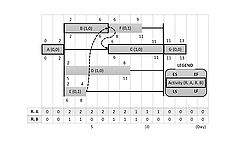
Considering then both the original relationships between activities and the resource links found in Step 2, LS and LF for each activity can be identified (Figure 10).
Step 4: Finding unidentified resource links
In the result of step 3, the TF of a critical activity, which is calculated using the formula
- TF(i, j) = LS(i, j) - ES(i, j),
is obviously equal to zero: any delay of it will, in fact, extend the project completion time. However, the activity for which TF is not zero may not have its full floats if there is any resource constraint for the TF period.
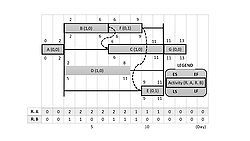
At this point, there are no resource links between activities if the completion of the prescheduled activities does not immediately affect the delayed activity’s start, although the released resources are transferred to the delayed activity. In order to find those unidentified resource dependencies, every activity of nonzero TF will be checked by delaying the completion time day by day, and a resource link will be created between activities that have resource dependency (Figure 11).
Step 5: Alternative schedule
The schedule resulted after Step 4 may be acceptable, but, due to the characteristics of the resource link, an activity that has successors by resource links may be delayed beyond its TF period without affecting the project completion time. Therefore, in this step, those activities will be checked to propose an alternative schedule.
For each activity, all resource links to successors will be temporarily removed; a certain available period will be then evaluated if the activity can be executed without violation of technological links and resource constraints. The available period starts from the earliest completion of all successors by resource links and continues to the earliest LS of all successors by the technological links. If there is no alternative schedule for the activity, the original resource links will be restored, but if there is any alternative schedule, the original resource links will be permanently removed for the alternative schedule of the activity and new resource links will be created according to the resource usage condition.
An alternative schedule is shown in Figure 12. However, this appears inferior to the previous one (Figure 11), because it makes two additional activities critical. This situation could be valuable in some special cases. For instance, if an activity must be delayed for some days due to certain reasons, the project completion may be extended so that the second alternative would be more convenient compared to the first one.
Observations
The Limitations of Critical Path Method
In summary, the Critical Path Method is believed to be a powerful tool since enables the project manager to meet deadlines at a reasonable cost. Moreover, the project manager can monitor the completion of day-to-day activities as against the time schedule specified by CPM[6]. Most importantly, it is used to give information regarding slack time, earliest/latest start and end time, parameters that can't be really calculated by using an RSC technique.
It was mentioned, though, that CPM algorithm is based on two assumptions, which are unlimited resources and unrestricted project completion deadline. In fact, the method assumes that a manager has detailed information about the duration, size, and performance of the different activities in a project, which may not be true in a real-life scenario. In addition, not all CPM networks can perform easy resource scheduling. The project manager must make an effort to reallocate resources with the aim of reducing the critical path[5]. CPM can be considered as a static planning model since it's unable to accommodate the natural dynamism of a project: in case of any changes in the network, the entire evaluation procedure must be repeated to determine the new critical path[6].
To resolve these limitations, CPM is needed to be supplemented by some heuristic and mathematical models.
The Benefits of Resource-constrained Critical Path Method
As was stated, a traditional CPM schedule is not realistic, because some resources are highly limited in practice. It was found that many disputes among project participants are triggered by incorrect scheduling information[2]. The proposed RCPM technique takes advantages of both the CPM and the RCS techniques, the latter considering resource limitations, but without providing correct total floats and critical paths.
The RCPM gives correct time data that are prerequisite for successful project planning and control[2]. The effect on the project duration and activity floats of varied resource availability can be studied through running RCPM on different scenarios of resources. This new approach highlights the dimension of the available resources and produces a detailed and feasible schedule for individual resources working on activities. This potentially leads to an integrated scheduling and cost-estimating process that will produce realistic schedules, estimates, and control budgets[10].
In a CPM schedule, activities are sharing total float only if they are on the same chain. In the RCPM schedule, due to sharing of resources, some parallel activities, not in the same chain, can share floats, and these can be consumed by any activity that needs them first (an additional resource link is required to reflect the condition)[2].
Undoubtedly, other studies need to be conducted to improve the RCPM technique explained in this article. The dynamic features of resource links related to schedule updates and shared floats need to be studied further to provide a better rationale for scheduling, control, and time impact analysis. In addition, effects on resource links from variable (and not static, as the ones presented in this article) resource requirements and availability should also be investigated[2].
References
- ↑ 1.0 1.1 1.2 1.3 Project Management Institute, "A guide to the project management body of knowledge (PMBOK® guide) - Fifth edition". (2013)
- ↑ 2.00 2.01 2.02 2.03 2.04 2.05 2.06 2.07 2.08 2.09 2.10 2.11 2.12 2.13 Kyunghwan Kim and Jesùs M. de la Garza, "Phantom Float". Journal of Construction Engineering and Management, Volume 129, No. 5 (October 1, 2003)
- ↑ 3.0 3.1 Paing Hein Soe and Thein Min Htike, "Critical Path Analysis programming method without network diagram". MATEC Web Conference, Volume 192 (2018)
- ↑ 4.0 4.1 Rafik Nafkha and Artur Wilinski, "The Critical Path Method in estimating project duration". Information Systems in Management, Volume 5, No. 1, Pages 78−87 (2016)
- ↑ 5.0 5.1 Arin Wulandari, M. Dachyar and Farizal, "Scheduling of Empennage Structure Design Project of Indonesia’s Aircraft with Critical Path Method (CPM)". MATEC Web Conferences, Volume 248 (2018)
- ↑ 6.0 6.1 6.2 Nishi Sharma and S. B. Gupta, "Applications of Critical Path Method in Project Management". International Journal of Management and Economics, Volume 1, No. 26 (November, 2018)
- ↑ 7.00 7.01 7.02 7.03 7.04 7.05 7.06 7.07 7.08 7.09 7.10 7.11 Earl B. Anderson and R. Stanton Hales, "Critical Path Method Applied to Research Project Planning: Fire Economics Evaluation System (FEES)". Gen. Tech. Rep. PSW-GTR-93. Berkeley, CA: U.S. Department of Agriculture, Forest Service, Pacific Southwest Forest and Range Experiment Station. 12 p. (1986)
- ↑ 8.0 8.1 R.L. Martino, "Applying Critical Path Method to System Design and Installation". Control Engineering, Volume 10, Issue 2, pp. 93-98 (1963)
- ↑ Kyunghwan Kim and Jesùs M. de la Garza, "Evaluation of the Resource-Constrained Critical Path Method Algorithms". Journal of Construction Engineering and Management, Volume 131, No. 5 (May 2005)
- ↑ Ming Lu and Heng Li, "Resource-Activity Critical-Path Method for Construction Planning". Journal of Construction Engineering and Management, Volume 129, No. 4 (August 2003)
Annotated Bibliography
Kyunghwan Kim and Jesùs M. de la Garza, "Phantom Float". Journal of Construction Engineering and Management, Volume 129, No. 5 (October 1, 2003)
The article provides a very good description of the Resourced-constrained Critical Path Method, improving the existing Critical Path Method and Resource-Constrained Scheduling techniques. It describes a step-by-step procedure of RCPM, providing also a Primavera Project Planner integrated system where the method is implemented.
Earl B. Anderson and R. Stanton Hales, "Critical Path Method Applied to Research Project Planning: Fire Economics Evaluation System (FEES)". Gen. Tech. Rep. PSW-GTR-93. Berkeley, CA: U.S. Department of Agriculture, Forest Service, Pacific Southwest Forest and Range Experiment Station. 12 p. (1986)
This report presents the critical path method as a technique for planning, scheduling and monitoring projects, by explaining the mathematical concepts behind the method. It provides the basic knowledge of the methodology and the different CPM steps. The article illustrates how a computerized CPM approach can be applied to resource management or other research projects. Furthermore, the article provides a short introduction on a resource as well as a time-cost analysis.
Ming Lu and Heng Li, "Resource-Activity Critical-Path Method for Construction Planning". Journal of Construction Engineering and Management, Volume 129, No. 4 (August 2003)
The paper presents a practical method that was developed in an attempt to address the limitations of existing methods. The new approach is called Resource-Activity Critical Path Method (RACPM), and it is applied to an example problem for illustrating the algorithm and comparing it with the existing method.
Kyunghwan Kim and Jesùs M. de la Garza, "Evaluation of the Resource-Constrained Critical Path Method Algorithms". Journal of Construction Engineering and Management, Volume 131, No. 5 (May 2005)
This paper evaluates the RCPM technique by comparing it to five previous studies. A brief review of each study is also included. The comparison should be of interest to academics because it highlights the advantages and disadvantages of different RCPM algorithms that have attempted to overcome present problems in traditional resource-constrained scheduling techniques.
