X-Matrix Hoshin Kanri
X-Matrix is a powerful tool from Hoshin Kanri that sums up in a single document the strategies, tactics, processes, and people involved in the achievement of project success. It is a dynamic tool and the process results, financial impacts and cost could be recorded during the project execution. The main aim of this tool is to help the project manager in the communication of the project stages to the internal team and stakeholders. Moreover, it provides a visual explanation of how the different steps are correlated and how they contribute to the project's success. The implementation of this simple tool in the planning phase of a project and its subsequent monitoring during the implementation stage makes it easy to align plans and goals between each team within the organization. Considering that in the practice[1] [2] , most of the project's failure relies on not investing enough time and resources in the communication of project scope and goals, the importance of such a tool is undeniable. This article provides a brief introduction to the Hoshin Kanri methodology. Then the X-Matrix structure will be explained sustained by a practical example of its implementation. As a third point, an overview of possible variants from the literature will be provided. In fact, this article focuses on the application of X-Matrix to project management but it is possible to apply it also to program management and portfolio management. Finally, the limitation of its application in project management will be discussed.
Contents |
Hoshin Kanri
As mentioned, X_Matrix is a pillar-tool of Hoshin Kanri methodology. Hoshin Kanri is formed by the two Japanese ideograms Hoshin (policy) and Kanri (management). The term policy management doesn’t reflect the meaning and purpose of Hoshin Kanri, which mostly is organizational learning method and competitive resource development system[3]. Hoshin Kanri was developed in Japan, to address the Japanese Industry's need for change in structure in order to be competitive in a global dimension. The term Hoshin Kanri has been used for the first time by Bridgestone Tire in 1964 and since 1980 the methodology has been adopted worldwide[4]. "Hoshin Kanri" in the literature </ref name="lean book"> is considered a strategic management method and it is mainly applied to define company strategy from the long term to the immediate actions every time that a strategic change affects the organization. It could be also implemented to manage complexity, the launch of a new product, or the implementation of a new process. Moreover, it is also used to manage projects and programs, especially the ones which require cooperation between organizational functions.
Hoshin Kanri systematically applies Deming Cycle (PDCA) at each organizational level. Usually, a Scan stage of the current situation is carried on before the DO stage: Thus, PDCA becomes SPDCA. Furthermore, the stages are shared and nest within the company, as can be observed in the right figure below. Hoshin Kanri is meant to align strategic and long-term plans, settled by the top manager, with mid-term goals and everyday activities. Thus, four teams are created and each worker within the personnel belongs to one of them.
- Hoshin team: normally it coincides with the top management team. The group has the overall responsibility to set long-term initiatives, mid-term plans, and annual Hoshin ( goals that should be reached within one year). Additionally, they are responsible for the choice of the composition of the following teams.
- Tactical team: is the team of people in charge of developing new specific skills by implementing technologies and methods in the general business process. It is usually formed by highly qualified experts in the project field. They help the Hoshin team set strategic goals with a 6-12 months time horizon.
- Operational team: the people who are undertaken to carry on, improve and supervise concrete and standard processes that support the tactical plans.
- Action team: the cross-functional group that is in charge to apply tools and techniques to daily tasks. Their role is active and not passive, in fact, they must provide suggestions to implement kaikazu and kaizen in the project.
Usually, the teams are cross-functional. As result, strategy and goals are shared and every single worker is involved in kaizen (continuous improvement).
Hoshin Kanri and X-Matrix in project management
Hoshin Kanri methodologies and tools for strategic management could be easily applied to project management. Obviously, teams and tools would be adapted to the specific field. Regarding the four teams, the Hoshin team in the case of project management would include the project manager and its staff. The team is undertaken to set the project scope, define budget and timeline, and superintend the correct project implementation over time. The function of the other teams remains unaltered. In the British Standard [5] plan stage is defined as "A detailed proposal for doing or achieving something which specifies the what, when, how and by whom it will be achieved". X-Matrix registered all the informaton request from a plan. Thus,considering the application of the Hoshin Kanri methodology to project management [6] the X-Matrix tool is implemented in the Plan stage. X-Matrix could be seen both as a memorandum for the Hoshin team and a visual tool to communicate and align the plans at each organizational level.
X-Matrix structure
The Matrix is divided into four blocks, called also dials, linked by four correlation matrixes. Starting from the left block (the “east” block) and proceeding clockwise, it is possible to identify the four main dials: Strategies, Tactics, Processes, and Results. In addition, the People block is to the right side of the Process ones. Each of the dials is linked to the following one by a correlation matrix, which will be explained later in the article.
The idea behind the tool is that a project scope could be split up into goals. The goals’ achievement determines project success. The 100% rule [6], set by the Project Management Institute (PMI) for WBS, states that “‘the next level of decomposition of a WBS element (child level) must represent 100 percent of the work applicable to the next higher (parent) element’’. Following a similar approach, each goal could be broken down into lower-level goals. Each goal will be part of one of the following categories in decreasing level order: Strategic and Tactical and Process goals. Performing carefully this top-down decomposition is vital for the project's success and for the correct implementation of the X-Matrix.
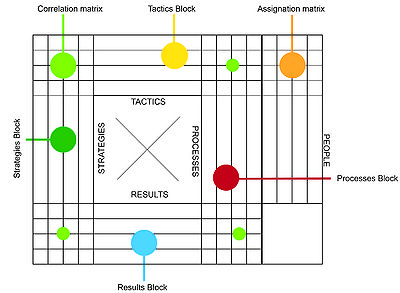
Strategies block
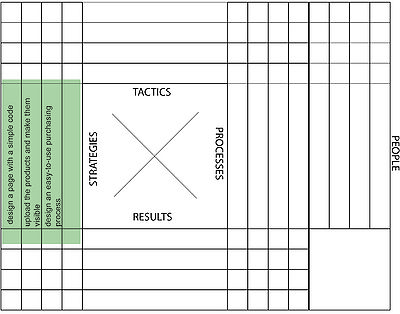
The Strategies Block is the mover of the entire X-Matrix and it is the first that should be filled up. The strategic goals are the first level of scope decomposition and each of them should be inserted into a row in the strategies block. The strategic goals must be expressed in general terms and, at the same time, they should clearly communicate the direction of the entire project. Each strategic goal will occupy a row in the strategies' block. It is suggested to limit the number of strategic goals to avoid excessive complexity in the next steps.
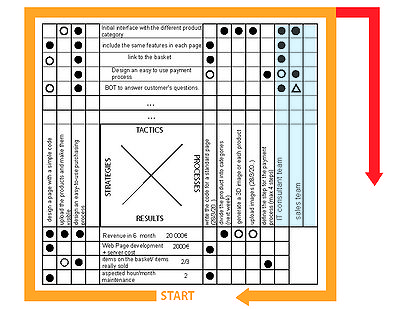
To provide a better explanation of the tool and each of its blocks, it is provided an example of a simple project: a company wants to sell its product online by implementing a customer-attractive new webpage. The company employees are not high skilled programmers, but to reduce the costs they want to do the future webpage maintenance by themselves. As consequence, the scope of the project is to design efficiently the web page and make it accessible to the customer. The scope could be split into strategies: design a page with a simple code, upload the products and make them visible, design a purchasing process easy to use for the customers.
Tactics Block
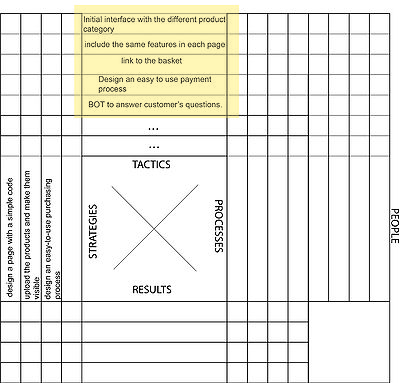
For each row in the strategies block, a set of tactical goals should be drawn up. A set of tactical goals is much more detailed than the related strategic goal and clearly shows the action to be implemented to achieve it. As in the previous block, each row in the block contains one tactical goal. This block is linked to the strategic and processes ones by a correlation matrix. Moreover, each tactic is assigned to a person or a team. The responsible for each tactical activity can be found consulting the assignation matrix that linked the strategy dials with the people ones. Referring to the project example, the strategic goal “design a process easy to use for the customers” could be split into: create an initial interface with the different product category, include the same features in each page, always include a direct link to the basket, design an easy to use payment process, including a BOT to answer customer’s questions.
Processes Block
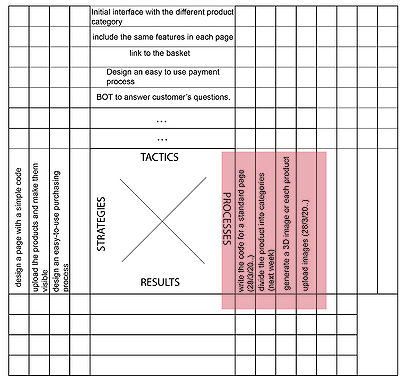
Each row in the processes block shows a detailed action needed to achieve a tactical goal. The start and finish date and an estimation of the cost must be included for each process. It is allowed just one performance indicator for each process, that has to be carefully chosen: it must be pertinent, easy to measure and to monitor.
For this project, some valuable processes could be “divide the product into categories (next week)”, “write the code for a standard page within 1 month” “generate a 3D image for each product and upload it within 1 month”.
Results Block
The scope of a project should be converted into measurable results. Each result will occupy a row in this table. In the most of the case, the costs and revenues from project success are registered. Anyway, it is not a limitation: each result address to be specific, measurable, achievable, relevant, and trackable (SMART) could be assessed. The importance of this block is central, especially during the implementation phase of a project. As mentioned before, X-Matrix is both a static and dynamic tool. It is defined in the Plan stage, but it is possible to modify the differents block according to the project ****. The project manager, as well as the Hoshin team, are the ones in charge to monitor the correct implementation of the whole project and they should bring particular attention to the results block. Every change in the project should be reported in the results dials, thus corrective actions could be planned. When the check phase, the real cost, time, revenue (or the chosen relevant indicator) should be reported. In the end, a comparison between the initial plan and the real one could be done. This will determine the project's success or failure.
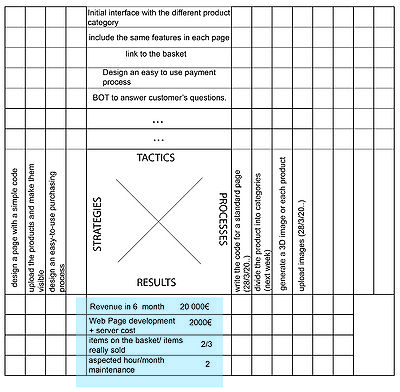
Referring to the example, some interesting results to measure regard both the economical aspect and indicators reflect the real accessibility of the page for the customers and the maintenance. As economical results, the webpage development cost, server cost, and revenues within six months would be the major aspects to focus on. Regarding the efficiency of the webpage, the percentage increase of visitors within six months, the average time spending by a customer on the page, and the ratio between the number of items added to the basket and the items sales, provide a good overview of the customer satisfaction. As stated in the beginning, one of the strategic goals is to create a page easy to maintain by the employees. So, the difference between the aspected hours spent on maintenance per month and the real ones is an aspect that determines project success or failure.
People Block
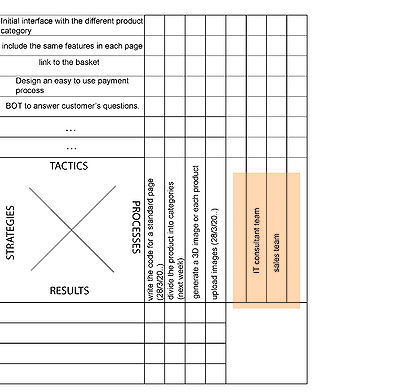
People block is situated on the extreme right of the tool, next to processes one. It is linked to the tactics dial through an assignation matrix that clearly shows the people or the team assigned to the specific goal. Considering the continuous increase of complexity degree within projects, it is vital to state who is responsible for a certain activity. It will avoid future misalignment and confusion regarding responsibility. One of the Hoshin Kanri pillars is that everyone should contribute to the kaizen. The direct assignation of a person or team to a specific job through the assignation matrix and the understanding of each process involved in the final result, empower the responsible that will put more effort into achieving that goal.
In the specific case of this article, the teams involved in the project would be an IT consultant team that helps the company to design the webpage. At a first look could seem that they are the only one that will work on the project, but they are not. Such a consultant team should be supported by a team internal to the company that could provide them useful pieces of information which will be translated into code or upload to a specific page. For example, the "Sales department" could divide the products into categories and individualize which product could represent each category. Then, the IT team will place each product on an appropriate category page and the representative one on the main page.
Correlation Matrix
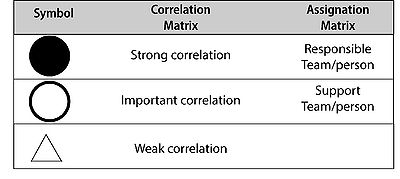
Four correlation matrixes linked the four main dials: strategies, tactics, processes, and results. The relationship between the goals of each block is shown by the use of a specific symbol. Thus, every worker in the project could have an overview of how the tasks are related. Moreover, it is possible to have a general idea of which tasks are critical for the project's success and which change in the plan would compromise the results of the entire project. The assignation matrix, the one up to the People block, uses the same symbols as the correlation matrixes. In this case, the presence of the symbols indicates the degree of responsibility that the team or person has in the related task. The meaning of each symbol could be read in the table [7] below. If two items are independent, no symbols are registered in the matrix.
How to complete, read and monitor the X-Matrix
Considering that the principal function of this tool is to communicate graphically a project structure and share information across the organization, the tool drafting and reading follow a specific process. The X-Matrix is principally a top-down rollout process in the planning phase, thus the blocks are filled up in the following order: Strategies and Results, Tactics, People, and Processes. Due to their interdependency, Strategies Block and Results Block are completed together, setting both the high-level goals according to the budget, costs, and timeline. The correlation matrixes and the assignation ones should be implemented step by step. To read the X-Matrix, the suggested order reflects the implementation ones.
X-Matrix is also a dynamic tool that can provide initial guidelines when KPIs measurement are misaligned with the forecasted ones. A bottom-up approach occurs when individualizing a deviation from the aspect KPIs and consequentially the results are assessed and preventive actions take place to prevent a possible failure.
Variant: a study from the literature
The knowledge about X-Matrix is not deeper as other Lean tools and literature doesn't provide many examples of its implementation in project management. More examples could be found about X-Matrix and program management. An interesting study regards the application of X-Matrix to planning a program in an Italian University Hospital [8]. It was asked to the participants, both manager and first-line employee of the hospital, to draw a program with the main of improving hospital efficiency. It deals with three main projects: increase the efficiency of the surgery's process, create a central laboratory, build a blood transfusion center. As for project management, also for in program management the X-Matrix tool fall in the planning stage. It was asking to the participant to register the output of the planning stage using X-Matrix. The three main projects were registered into the "Strategic block", while the budget of each project and the specific goals, like "increase the number of surgery by 2% and reduce the waiting list by 5%", into the "Results Block". Following the process of goal decomposition explained above each sub-task occupied the "Tactics" and "Processes" blocks. All the feedback from the experiment clearly highlights the benefits of applying X-Matrix in the planning stage to a wide program in a challenging environment like a hospital. The simulation proved the X-Matrix value in supporting the Hoshin team in the preliminary discussion as well as facilitate the communication between cross-functional teams to align the final objective. For more information about this study, refer to the References paragraph.
Limits
The deployment of X-Matrix has some important limitations that could affect its effectiveness. As explained in the introductory paragraphs, this tool is a valuable memorandum that records the principal point of the project and split up the scope into four implementation levels. Its shape is in itself a limitation therefore it is not possible to break down the scope into more than four levels. This could be an important limit, especially for big projects with many tasks. On the other hand, managing such big projects require the use of different planning tools like [link] Gantt chart, WBS, Balance scorecard, and others. Thus, X-Matrix could be seen as integration to provide a complete overview of how the principal activities are structure. Moreover, it could be applied by a specific team to split up the key activity (strategic or tactical) to which it is assigned to.
Another limitation that could affect the communication aim regards the number of activities that are possible to insert in each level. The X-Matrix shape is thought to fit in an A3 report, align with the other Lean tool. An excessive number of tasks would affect both its dimension that will exceed the A3 format and the readability of the X-Matrix of primary importance for the communication flow between the teams.
Annotated Bibliography
In this section the principal references used in the article are briefly discussed.
- T.L.Jackson "Hoshin Kanri for the Lean Entreprise: Developing Competitive Capabilities and Managing Profit" : this book provides a solid and clear introduction to Hoshin Kanri methodology. Referring to a real case, its implementation is extensivly commentated. All the tool are fully explained, with a particular attention to the X-Matrix and the interaction between the different tools.
- Andrea Payaro, "Lean Management: cose mai dette" : unfortunately this book is avalable only in Italian. It provides a brief but complete overview of probably every existent lean tool. The author comment and describe the application of each tool, supporting it with useful images and template.
References
- ↑ R.N.S.A. Hughes DL, "The changing landscape of IS project failure: an examination of the key factors," Journal of Enterprise Information Management, vol. 30, pp. 142-165, 2017
- ↑ T.R.A.J.S. Dov Dvira, "An empirical analysis of the relationship between project planning and project success," PMI statics
- ↑ 3.0 3.1 T.L.Jackson, Hoshin Kanri for the Lean Entreprise: Developing Competitive Capabilities and Managing Profit
- ↑ MCTS web page, Hoshin Story
- ↑ Business Case Theme. (2018). In Prince2® Study Guide (pp. 93-95). John Wiley & Sons, Ltd. http://ebookcentral.proquest.com/lib/dtudk/detail.action?docID=4863041
- ↑ 6.0 6.1 Project Management Institute, Guide to the Project Management Body of Knowledge (PMBOK® Guide) (6th Edition), Project Management Institute Inc., (2017)
- ↑ 7.0 7.1 7.2 7.3 7.4 7.5 7.6 Andrea Payaro, Lean Management: cose mai dette. Società editorial Esculapio, 2018
- ↑ F.Barnabè,M.C.Giorgino,Practicing Lean strategy: Hoshin Kanri and X-Matrix in a healthcare-centered simulation,2017 [1]
