Decision making under risk
| Line 56: | Line 56: | ||
</gallery> | </gallery> | ||
| − | <br clear=all> | + | <br clear=all> |
| + | |||
Revision as of 10:47, 21 June 2017
Decision making is one of the most important tasks in the management process and it is often a very difficult one. When having knowledge regarding the states of nature, subjective probability estimates for the occurrence of each state can be assigned. In such cases, the problem is classified as decision making under risk. In the decision making process, all relevant information is evaluated through decision analysis (DA). The decision analysis process consist of the use of a decison tool and a decsion theory. The decision tree is the most commonly applied decision tool in the decision analysis. The decision theory of interest in the decision analysis, regarding the decision making under risk, is the expected value of criterion also reffered to as the Bayesian principle. This is the only one of the four decision methods that incorporates the probabilities of the states of nature.
Contents |
Methologdy
Risk analysis and risk management is an important tool in the construction management process. Risk implies a degree of uncertainty and an inability to fully control the outcomes or consequences of such an action. The objective of a decision analysis is to discover the most advantageous alternative under the circumstances.
Decision analysis is a management technique for analyzing management decisions under conditions of uncertainty. The decision problems can be represented using different statistical tools applied to the mathematical models of real-world problems. An important and relevant decision tool to represent a decision problem is a decision trees. A decision tree is a graphical representation of the alternatives and possible solutions, also challenges and uncertainties. In decision analysis, formulating the decision problem in terms of a decison tree is a Favorable visual and analytical support tool, where the expected values of competing alternatives are calculated.
Decision tree
A decision tree is a schematic, tree-shaped diagram representation of a problem and all possible courses of action in a particular situation and all possible outcomes for each possible course of action.
Decision trees is an effective decision tool in the decision-making, because it:
- Clearly lay out the problem so that all options can be challenged
- allow to fully analyse the possible consequences of a decision
- provides a framework in which to quantify the values of outcomes and the probabilities of achieving them
- helps make the best decisions on the basis of existing information and best guesses.
It is particularly useful where there are a series of decisions to be made and/or several outcomes arising at each stage of the decision-making process. The decision may be dependent on more than one uncertain variable.
Construction of decision tree
A decision tree consists of three type of nodes, there is no universal set of symbols used when drawing a decision tree but the most common ones is:
- Decision (choice) Node – square
- Chance (event) Node - circles
- Terminal (consequence) Node – triangles
A Decision Tree is a chronological representation of the decision process. For the understanding of the decision tree analysis, a simple example is provided.
Example
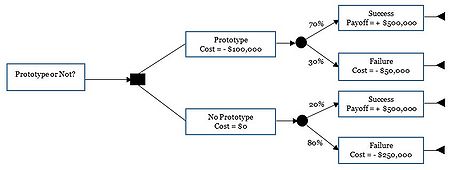
The example consist of a simple situation, that could represent a every-day situation in the constrution mangemant process. A prototype for a project (example a mock-up on the facades) are being constructed. The cost of the prototype is $100,000, and not cost is related if the prototype aren't being prusued. The first step is therefore the decsion, do the prototype or not? Figure 1 represent the onstruiton of the decision node process.
The decision tree is drawn chronological from left to right. The construction of a simple decision tree is provided in this article. Figure 1 shows the first step, which consists of the decision node. The example is based on the use of a prototype, the first decision is weather or not to do the prototype.
Let’s work through an example to understand DTA’s real world applicability.
To begin your analysis, start from the left and move from the left to the right. First, draw the event in a rectangle for the event — “Prototype or Not.” This obviously will lead to a decision node (in the small, filled-up square node as shown below).
From there, you have two options — “Do Prototype” and “Don’t Prototype.” They are also put in rectangles as shown below.
Since there are two options, the tree is constructed with two branches coming from the decision point.
/

