PERT
(→Assumptions and palliation of disadvantages.) |
(→References) |
||
| Line 182: | Line 182: | ||
*10. Intervention (India) PVT.Ltd. (18/09/2017), "PERT/CPM for Project Scheduling & Management", http://www.interventions.org/pertcpm/ | *10. Intervention (India) PVT.Ltd. (18/09/2017), "PERT/CPM for Project Scheduling & Management", http://www.interventions.org/pertcpm/ | ||
| + | |||
| + | The major advantages and disadvantages and how to palliate them are explained in the following article. | ||
| + | |||
| + | *11. OBS Business School (20/09/2017), "Principales usos y beneficios del diagram PERT", http://www.obs-edu.com/int/blog-project-management/planificacion-de-las-actividades-y-tiempo-de-un-proyecto/principales-usos-y-beneficios-del-diagrama-de-pert | ||
Revision as of 09:25, 21 September 2017
Contents |
Abstract
The program (or project) evaluation and review or PERT is a statistical tool designed to analyze and represent the tasks involved in completing a given project. It is used in project management and commonly together with the critical path method or CPM to control, plan and schedule.
This project management method is used for analyzing all the tasks involved in completing a project focusing on dealing with completion time rather than the costs of the project. It incorporates details about all the task such as their duration and required finished activities, also managing the uncertainty of the complete duration of each task.
PERT and CPM are often used together due to the fact that they complement each other, while CPM uses one time and one cost estimation, PERT uses three time estimates, but no costs for each activity. However, PERT use has been increasingly applied to all CPM scheduling.[1]
History
The development of this method was done by the U.S. Navy Special Projects Office in 1957 to support the Polaris nuclear submarine project and extended all over the industry. An example of its early use was the 1968 Winter Olympics in Grenoble. Roughly at the same time, DuPont developed the critical path method.
PERT model was the first of its kind, reviving scientific management founded by Frederick Taylor (Taylorism) and later refined by Henry Ford (Fordism), first stood for Program Evaluation Research Task and later renamed in 1959 [2]. Made public in 1958 in two publications of the U.S. Department of Navy, Program Evaluation Research Task, Summary Report, Phase 1 [3] and Phase 2 [4].
In 1959 Willard Fazar, Head of the Program Evaluation Branch, Special Projects Office, U.S. Navy, in an article in The American Statistician explained:
“Through an electronic computer, the PERT technique processes data representing the major, finite accomplishments (events) essential to achieve end-objectives; the inter-dependence of those events; and estimates of time and range of time necessary to complete each activity between two successive events. Such time expectations include estimates of "most likely time", "optimistic time", and "pessimistic time" for each activity. The technique is a management control tool that sizes up the outlook for meeting objectives on time; highlights danger signals requiring management decisions; reveals and defines both methodicalness and slack in the flow plan or the network of sequential activities that must be performed to meet objectives; compares current expectations with scheduled completion dates and computes the probability for meeting scheduled dates; and simulates the effects of options for decision — before decision” [5]
Including in the PERT a new tool for the subdivision of work units[6], the Work Breakdown Structure was introduced as the first item of analysis in carrying out basic PERT/COST [7].
Terminology
In order to understand all the terms that are used while drawing and using the PERT diagram, a list of concepts is defined below.
Events and activity
- PERT event. The point that marks the start or completion of one or more activities.
- Predecessor event. The event which immediately precedes some other event without the intervention of any other event. One event can be the predecessor of multiple events or vice versa.
- Successor event. The event that immediately follows some other event without the intervention of any other event. One event can be the successor of multiple events or vice versa.
- PERT activity. Performance of a task which consumes time and resources. It can be also understood as the representation of the time, effort, and resources required to go from one event to another. Cannot be started before all the predecessor events have occurred.
- PERT sub-activity. Decomposition of an activity into smaller activities.
Time concepts
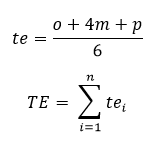
- Optimistic time. Minimum time required to accomplish an activity (o) or path (O). It has to be assumed that things will go better than normally.
- Pessimistic time. The maximum possible time required to accomplish an activity (p) or path (P). It has to be assumed that everything that can go wrong, will do. However, major catastrophes have to be excluded.
- Most likely time. The best time estimation of the accomplishment of an activity (m) or path (M). It is assumed that everything goes as expected.
- Expected time. The best estimation of the time needed to accomplish an activity (te) or path (TE), taking into account that complications might appear.
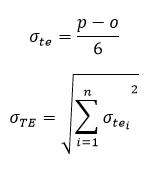
- The standard deviation of time. Variability of the time for accomplishing an activity (σte) or path (σTE).
Other concepts.
- Float or slack. Excess of time and resources available to complete a task.
- Critical path. The longest possible continuous pathway from the initial event to the terminal event. It determines the shortest time for the project completion.
- Critical activity. Activity with no float. It might not be on the critical path.
- Lead time. The time by which a predecessor event must be completed to allow enough time for the activities that must elapse before a specific PERT event reaches completion.
- Lag time. The earliest time by which a successor activity can follow a specific pert event.
- Fast tracking. Performing more than one critical activity in parallel.
- Crashing critical path. Shortening duration of critical activities.
Diagram
The drawing process of the diagram is divided into some steps and complementary techniques will be used to facilitate it. There are two types of PERT diagrams, "event-driven" in which the events are linked by activities and "activity-driven" in which the activities are linked by events.
Although there are software like "Microsoft Project" that can draw the PERT diagram, it is important how to draw it in order to understand how it works.
Event-driven
Prior to starting drawing the PERT diagram, there are some rules that have to be followed to draw it correctly:
- There can only be one initial and final event. In other words, the initial event cannot have any predecessor activity and the final any successor.
- The enumeration of events is done randomly. However, the first event is usually 1 or 0 and the last event, the biggest number.
- The arrows are drawn in the direction of the sequence of events
- Two events cannot be linked to two activities directly.
- Activities with zero duration can be added in order to not break any rule, usually written as “f(0)”.
The first step is to make a list of all the activities including predecessor activities and expected time. This provides an overview of all the tasks involved in the project.
Secondly, a Gantt diagram can be drawn in order to have a more visual representation of the activities and their dependencies.
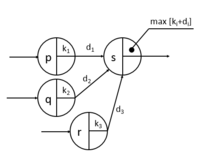
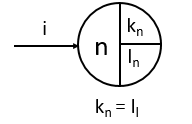
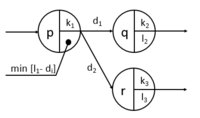
In this PERT diagram, the events are represented by a circle with its number, the activities are drawn as arrows linking the different events. Inside the circles, the starting and end point, are written. Starting from the initial event, with starting point 0, the rest of starting points of the rest of events is obtained by the sum of the longest path of predecessor activities.
Once the final event is reached, it has to be taken into account that the initial and the final point are the same, meaning the end of the project. In order to note the final point of the previous events, the inverse procedure is done.
The final point is determined by removing the duration of the successor activities starting from the final event. The slack can be calculated from the duration of the critical path by making the difference between the non-critical and the critical one. By definition, the initial and final activity, have zero slack.
Activity-driven
In order to perform the analysis, a more complete list of all the activities is made, this time including predecessor activities and different time estimations. In this model, the activities are represented as boxes with all the information and the events as the arrows linking them. The procedure to discover the critical path and slack is the same as before.
Advantages
- Better planning of the project and decision-making.
- Greater integration and presentation of the data.
- Optimizes the evaluation of the execution times.
- It provides each activity individual treatment and another integrated.
- Facilitates the identification of the critical points of the project.
- Promotes the elaboration of a master plan for every project. [11]
Disadvantages
- Subjectivity: the information obtained before the analysis limits the quality of the data. This might suffer a lack of objectivity due to the sources of information selected by the project manager. This fact influences the different time estimations and cost estimation.
- Effort: it requires time because of the detailed study of the activities involved in the project.
- Time focus: the PERT analysis focuses on the estimated duration of each activity, but those estimations might be wrong and have a big impact for the whole project.
- Update: the different activities involved in the project might suffer changes which have to be integrated with the PERT diagram in order to avoid erroneous decisions made based on a tool not showing the real situation of the project.
- Critical path: the PERT diagram is based on probabilities and the critical path is found using them, therefore any change or error of the activities involved in the critical path might change it and reveal the project has been focusing on the wrong activities.
- Loss of efficiency: if the dependencies of the activities are changed, that will conduct to a less efficient project.[11]
Assumptions and palliation of disadvantages.
The PERT model establishes that an activity cannot start until the predecessor one has been terminated, while in reality it is possible. When an activity is expected to not meet the established duration, new alternatives are seek in order to start the next activity without terminating the previous one.
Since the PERT diagram is very static, this can be compensated by quick updates of the diagram or being flexible. This fact is especially important when project counts with experienced managers and also when the uncertainty is high.
Other limitations are palliated by taking into account some recommendations:
- The PERT diagram should be used as a tool to facilitate the management, it is based on assumptions and time estimation that may be incorrect.
- Being to be able to update the diagram is crucial. For this reason, collaboration is very important and therefore, a good information flux among the people involved in the project and platforms to allow it have to be habilitated by managers.
- Using other techniques such as Gantt diagram, as mentioned before, to complement the PERT diagram can be helpful to have a better overview of the project.
- Automatization of processes. Nowadays technology is one of the most powerful tools for managers. Using specialized software for drawing the PERT diagram and doing online updates can minimize errors related to the information flow within the people involved in the project.[11]
References
In these documents, it is explained how the PERT diagram was used during the first year after its development
- 1. Brennan, Maribeth, PERT and CPM: a selected bibliography, Monticello, Ill., Council of Planning Librarians, 1968. p. 1.
- 2. Malcolm, D. G., J. H. Roseboom, C. E. Clark, W. Fazar. "Application of a Technique for Research and Development Program Evaluation," OPERATIONS RESEARCH, Vol. 7, No. 5, September–October 1959, pp. 646–669
- 3. U.S. Dept. of the Navy. Program Evaluation Research Task, Summary Report, Phase 1. Washington, D.C., Government Printing Office, 1958.
- 4. U.S. Dept. of the Navy. Program Evaluation Research Task, Summary Report, Phase 2. Washington, D.C., Government Printing Office, 1958.
- 5. Willard Fazar cited in: B. Ralph Stauber, H. M. Douty, Willard Fazar, Richard H. Jordan, William Weinfeld and Allen D. Manvel. "Federal Statistical Activities." The American Statistician 13(2): 9-12 (Apr., 1959) , pp. 9-12
- 6. Desmond L. Cook (1966), Program Evaluation and Review Technique. p. 12
- 7. Harold Bright Maynard (1967), Handbook of Business Administration. p. 17
In these references, it is explained more deeply how to construct the PERT diagram and calculation bases.
- 8..IUSC (19/09/2017), "Cálculos", http://www.iusc.es/recursos/gesproy/textos/03.03.02.03.htm (spanish)
- 9.IUSC (19/09/2017), "Cuerpo", http://www.iusc.es/recursos/gesproy/textos/03.03.02.02.htm (spanish)
- 10. Intervention (India) PVT.Ltd. (18/09/2017), "PERT/CPM for Project Scheduling & Management", http://www.interventions.org/pertcpm/
The major advantages and disadvantages and how to palliate them are explained in the following article.
- 11. OBS Business School (20/09/2017), "Principales usos y beneficios del diagram PERT", http://www.obs-edu.com/int/blog-project-management/planificacion-de-las-actividades-y-tiempo-de-un-proyecto/principales-usos-y-beneficios-del-diagrama-de-pert
