Poyber
| Line 9: | Line 9: | ||
[[File:Screenshot_2020-02-25_at_20.43.48.png]] | [[File:Screenshot_2020-02-25_at_20.43.48.png]] | ||
| + | |||
| + | == Problem Tree Analysis == | ||
| + | |||
| + | The problem tree analysis is a visual representation of a problem and its causes and effects. It is effectively used with broad issues where the consequences and root causes are not fully known. Since it enables breaking down a problem into manageable parts as well as generating discussions and sharing new views on a topic. The first step when creating a problem tree is to identify an issue to be analysed, the “focal problem”. Thereafter the causes and effects are identified and placed out on either the top or bottom, as seen in the picture below. | ||
| + | |||
| + | |||
| + | == Standardized work - LEAN == | ||
| + | |||
| + | Standardized work is a part of LEAN production that is performed to define and document what should be done, by who and when. The work sequences of a process are carefully studied when performed by employees and a takt time is decided. The purpose of the method is to communicate precisely how workers should perform so that variations in production are reduced while aiming for the optimal effectiveness and efficiency. Important to remember is that standardized work is not static, but a continuous process that can be improved at any time. | ||
Revision as of 10:26, 26 February 2020
Contents |
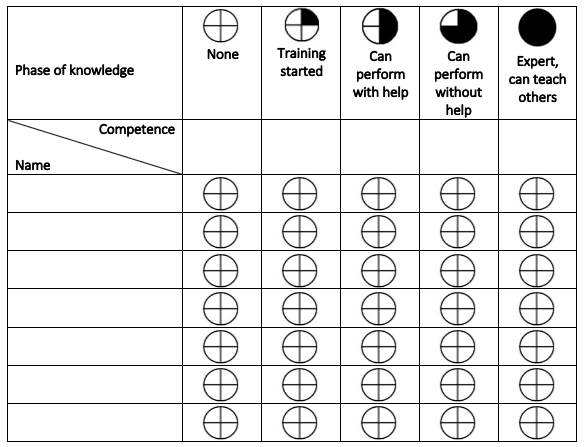
Competency Matrix - Abstract
A competency matrix is a tool used to map the different desired competencies of the employees in a team, project or organization. The tool visualizes and gives a comprehensive overview of what competencies each employee has, the competencies the team/project has, and it also identifies who lacks the training to achieve more competencies write. An example of how a competency matrix can look like can be seen at the table below:
Gantt Chart - Abstract
A Gantt chart is a project management tool used for organizing, planning, scheduling, and monitoring of projects and events. The Gantt chart breaks down projects to minor tasks/activities that are shown as a horizontal bar chart with a start and end date. Furthermore, the Gantt chart also shows dependencies (among activities), if activities overlap, scheduling, deadlines, who the activity should be performed by, resources needed, cost of activity, etc. It illustrates and creates an overview of the progress/phase of the project and gives information related to time, costs, and resources (planned and actual). An example of a very simple Gantt chart can be seen below:
Problem Tree Analysis
The problem tree analysis is a visual representation of a problem and its causes and effects. It is effectively used with broad issues where the consequences and root causes are not fully known. Since it enables breaking down a problem into manageable parts as well as generating discussions and sharing new views on a topic. The first step when creating a problem tree is to identify an issue to be analysed, the “focal problem”. Thereafter the causes and effects are identified and placed out on either the top or bottom, as seen in the picture below.
Standardized work - LEAN
Standardized work is a part of LEAN production that is performed to define and document what should be done, by who and when. The work sequences of a process are carefully studied when performed by employees and a takt time is decided. The purpose of the method is to communicate precisely how workers should perform so that variations in production are reduced while aiming for the optimal effectiveness and efficiency. Important to remember is that standardized work is not static, but a continuous process that can be improved at any time.

