X-Matrix Hoshin Kanri
X-Matrix is a powerful tool from Hoshin Kanri that sums up in a single document the strategies, tactics, processes, and people involved in the achievement of project success. It is a dynamic tool and the process results, financial impacts and cost could be recorded during the project execution. The main aim of this tool is to help the project manager in the communication of the project stages to the internal team and stakeholders. Moreover, it provides a visual explanation of how the different steps are correlated and how they contribute to the project's success. The implementation of this simple tool in the planning phase of a project and its subsequent monitoring during the implementation stage makes it easy to align plans and goals between each team within the organization. Considering that in the practice, most of the project's failure relies on not investing enough time and resources in the communication of project scope and goals, the importance of such a tool is undeniable. This article provides a brief introduction to the Hoshin Kanri methodology. Then the X-Matrix, the structure will be explained, following by possible variants according to the application field. Finally, the advantages and disadvantages of its application will be discussed.
Contents |
Hoshin Kanri
Hoshin Kanri is formed by the two Japanese ideograms Hoshin (policy) and Kanri (management). The term policy management doesn’t reflect the meaning and purpose of Hoshin Kanri, which mostly is organizational learning method and competitive resource development system[1]. Hoshin Kanri was developed in Japan, to address the Japanese Industry's need for change in structure in order to be competitive in a global dimension. The term Hoshin Kanri has been used for the first time by Bridgestone Tire in 1964 and since 1980 the methodology has been adopted worldwide. Hoshin Kanri could be applied to reach different goals: manage complexity, launch a new product, manage strategic change within the organization. Moreover, it is also used to manage projects and programs, especially the ones which require cooperation between organizational functions.
Hoshin Kanri systematically applies Deming Cycle (PDCA) at each organizational level. Usually, a Scan stage of the current situation is carried on before the DO stage: Thus, PDCA becomes SPDCA. Furthermore, the stages are shared and nest within the company, as can be observed in the right figure below. Hoshin Kanri organizes personnel into four teams:
- Hoshin team: the group that is undertaken to set the project scope, define budget and timeline, and superintend the correct project implementation over time. Probably it will coincide with the project manager and managerial staff
- Tactical team: is the team of people in charge of developing new specific skills by implementing technologies and methods in the general business process. It is usually formed by highly qualified experts in the project field. They help the Hoshin team set strategic goals with a 6-12 months time horizon
- Operational team: the people who are undertaken to carry on, improve and supervise concrete and standard processes.
- Action team: the cross-functional group that is in charge to apply tools and techniques to daily tasks. Their role is active and not passive, in fact, they must provide suggestions to implement kaikaku and kaizen in the project.
Usually, the teams are cross-functional. As result, strategy and goals are shared and every single worker is involved in kaizen (continuous improvement).
X-Matrix implementation and structure
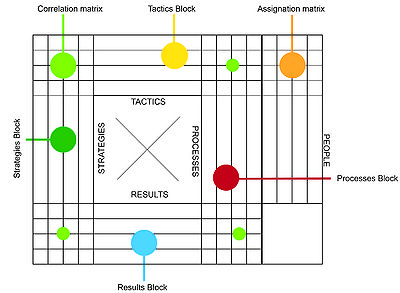
Considering the application of the Hoshin Kanri methodology to project management standards [2] the X-Matrix tool is implemented in the Plan stage. It could be seen both as a memorandum for the Hoshin team and a visual tool to communicate and align the plans at each organizational level. The Matrix is divided into four blocks, called also dials, linked by four correlation matrixes. Starting from the left block (the “east” block) and proceeding clockwise, it is possible to identify the four main dials: Strategies, Tactics, Processes, and Results. In addition, the People block is to the right side of the Process ones. Each of the dials is linked to the following one by a correlation matrix, which will be explained later in the article.
The idea behind the tool is that a project scope could be split up into goals. The goals’ achievement determines project success. The 100% rule, set by the Project Management Institute (PMI) for WBS, states that “‘the next level of decomposition of a WBS element (child level) must represent 100 percent of the work applicable to the next higher (parent) element’’. Following a similar approach, each goal could be broken down into lower-level goals. Each goal will be part of one of the following categories in decreasing level order: Strategic and Tactical and Process goals. Performing carefully this decomposition is vital for the project's success and for the correct implementation of the X-Matrix.
Strategies block
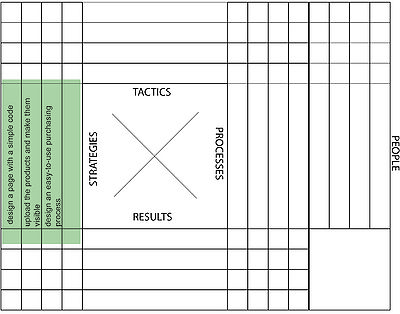
The Strategies Block is the mover of the entire X-Matrix and it is the first that should be filled up. The strategic goals are the first level of scope decomposition and each of them should be inserted into a row in the strategies block. The strategic goals must be expressed in general terms and, at the same time, they should clearly communicate the direction of the entire project. Each strategic goal will occupy a row in the strategies' block. It is suggested to limit the number of strategic goals to avoid excessive complexity in the next steps.
To provide a better explanation of the tool and each of its blocks, it is provided an example of a simple project: a company wants to sell its product online by implementing a customer-attractive new webpage. The company employees are not high skilled programmers, but to reduce the costs they want to do the future webpage maintenance by themselves. As consequence, the scope of the project is to design efficiently the web page and make it accessible to the customer. The scope could be split into strategies: design a page with a simple code, upload the products and make them visible, design a purchasing process easy to use for the customers.
Tactics Block
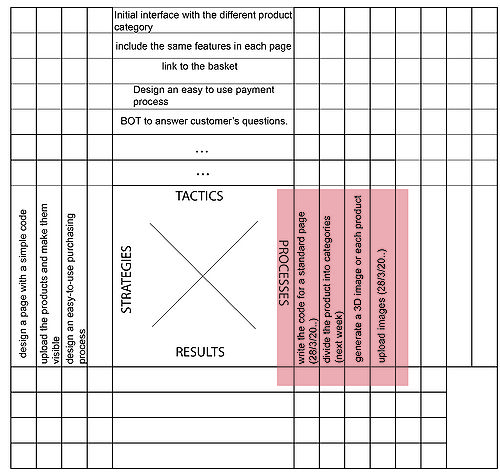
For each row in the strategies block, a set of tactical goals should be drawn up. A set of tactical goals is much more detailed than the related strategic goal and clearly shows the action to be implemented to achieve it. As in the previous block, each row in the block contains one tactical goal. This block is linked to the strategic and processes ones by a correlation matrix. Moreover, each tactic is assigned to a person or a team. The responsible for each tactical activity can be found consulting the assignation matrix that linked the strategy dials with the people ones. Referring to the project example, the strategic goal “design a process easy to use for the customers” could be split into: create an initial interface with the different product category, include the same features in each page, always include a direct link to the basket, design an easy to use payment process, including a BOT to answer customer’s questions.
Processes Block
Each row in the processes block shows a detailed action needed to achieve a tactical goal. The start and finish date and an estimation of the cost must be included for each process. It is allowed just one performance indicator for each process, that has to be carefully chosen: it must be pertinent, easy to measure and to monitor. For this project, some valuable processes could be “divide the product into categories (next week)”, “write the code for a standard page within 1 month” “generate a 3D image for each product and upload it within 1 month”.
Results Block
The scope of a project should be converted into measurable results. Each result will occupy a row in this table. In the most of the case, the costs and revenues from project success are registered. Anyway, it is not a limitation: each result address to be specific, measurable, achievable, relevant, and trackable (SMART) could be assessed. The importance of this block is central, especially during the implementation phase of a project. As mentioned before, X-Matrix is both a static and dynamic tool. It is defined in the Plan stage, but it is possible to modify the differents block according to the project ****. The project manager, as well as the Hoshin team, are the ones in charge to monitor the correct implementation of the whole project and they should bring particular attention to the results block. Every change in the project should be reported in the results dials, thus corrective actions could be planned. When the check phase, the real cost, time, revenue (or the chosen relevant indicator) should be reported. In the end, a comparison between the initial plan and the real one could be done. This will determine the project's success or failure.
Referring to the example, some interesting results to measure regard both the economical aspect and indicators reflect the real accessibility of the page for the customers and the maintenance. As economical results, the webpage development cost, server cost, and revenues within six months would be the major aspects to focus on. Regarding the efficiency of the webpage, the percentage increase of visitors within six months, the average time spending by a customer on the page, and the ratio between the number of items added to the basket and the items sales, provide a good overview of the customer satisfaction. As stated in the beginning, one of the strategic goals is to create a page easy to maintain by the employees. So, the difference between the aspected hours spent on maintenance per month and the real ones is an aspect that determines project success or failure.


