Portfolio Management using the BCG-Matrix
Developed by Alexander Michel
The Boston Consulting Group (BCG) matrix, also known as growth share matrix, is a tool to manage a company's business portfolio and derive appropriate actions towards a higher total performance. Depending on the growth rate and market share, each business is individually assigned to one of the four clusters inside the two-dimensional matrix. Based on that, the optimal combination of individual business strategies is developed to manage a company's business portfolio in such a way, that it can make the most out of its opportunities.[1]
Initially developed in 1970 by Bruce D. Henderson[2], a senior partner of the management consulting firm BCG, the concept has been widely applied since then and can be seen as a foundation for similar tools. Although the BCG describes it still as a relevant tool today, the growth share matrix has been criticized by professionals and academics for its limitations and underlying assumptions.
The following article will present the matrix developed by Henderson with its foundations and core elements. Hereafter, the application of the tool is shown with its implications for the business portfolio. These serve as a guideline for a company's overall strategy. Finally, limitations of the matrix are discussed based on empirical research and new findings.
Contents |
Key Assumptions and Core Elements of the Matrix
When the BCG-Matrix was developed, it met a real market need. Based on only a limited amount of input data (relative market share and market growth), senior executives gained a clear picture of their business portfolio in an increasingly complex environment. Furthermore, it could be used to communicate decisions to subsidiaries within the company.[3] At the time Henderson said about the matrix:[2]
Such a single chart with a projected position five years out is sufficient alone to tell a company's profitability, debt capacity, growth potential, dividend potential and competitive strength.
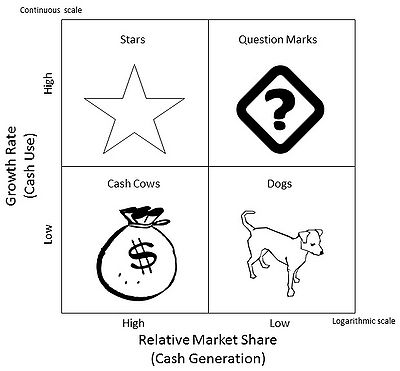
In order to understand this position, the underlying assumptions and core elements of the matrix are presented in the following. Basically, the matrix can be divided into six core elements, each with specific assumptions.[3][4] A basic model of the matrix is shown in Figure 1 which serves as an illustration for further discussion.
Classification of Businesses into Four Portfolio Categories
Henderson defines the four categories according to their potential for cash generation and cash requirement. These are defined as followed:[2]
- Stars
- Stars are in the upper left quadrant. Because of their rapid growth they require large amounts of cash, but at the same time they provide cash through their strong relative market position. Usually, these businesses are self-sufficient in cash flow. However, over time market growth will slow down which offers two choices. If stars can hold their market share they might become cash cows and net generators of cash, if they fail to be competitive they become dogs. Only few businesses within a company are stars.
- Cash Cows
- Cash cows are in the lower left quadrant. In these businesses growth is low but relative market share is high. This translates into businesses which generate far more cash than they require. Cash cows are vital for a company as they pay the dividends, cover the corporate overhead and provide the money for future investments. As with stars, a company usually only owns a few cash cows.
- Dogs
- Dogs are in the lower right quadrant. Operating in slow growing markets with a weak position, these businesses are known as cash traps as they provide little earnings but at the same time require some cash. Overall, they are worthless and a company should seek to minimize the assets within this category.
- Question Marks
- Question marks are in the upper right quadrant. With high growth but low market share question marks have the worst cash characteristics. Because of high growth they require huge amounts of cash but only provide very little as their market position is weak. Many businesses within a company fall into this category and key will be if a company can develop these business towards stars or cash cows. However, if this attempt fails, question marks become the ultimate cash trap as they only absorb large amounts of cash throughout their existence. A company has to make thoughtful decisions in which (few) question marks should be further invested and which ones should be liquidated on time in order to save resources.
Strategic Business Units (SBU) and Product Markets
Within the portfolio analysis usually different SBUs are analyzed. These describe a business focused on a particular product-market combination. It is essential that these are mostly independent from each other but have similar structures and resources. This is required to make decisions for each SBU independently without affecting others in the portfolio. However, the definition of SBUs might be challenging, as products within a SBU might have different market growth and relative market shares. Inside the matrix the relative significance of each SBU is displayed by the diameter of a circle, which can be made proportional to either sales or assets.[1]
Based on the experience curve concept, which Henderson introduced prior to the matrix in 1968, it is assumed that the company with the highest market share has the highest profit margin. The reason is, that the stronger the company’s position relative to its competitors, the higher profits should be and the simplest measure of relative competitive position is relative market share. It can be computed by the market share of a business (i.e. SBU) divided by that of the largest other competitor.[1] That means, the higher the relative market share is the more cash the business will generate.
Market Growth and Cash Use
The assumption made here is that market growth relates to the opportunity for investments. Growing business offer the ideal vehicle for investment, as money put into the business will compound over time and provide even higher returns in the future. However, the lager a market is growing the more cash is required to maintain market share and competitive position. Within the BCG-Matrix market growth is the only indicator for the attractiveness of a market.
Balance of Cash Flows
The key concept of the BCG-Matrix is to reach a balance of positive and negative cash flows between the different businesses. As shown before, each field can be defined as a net cash generator or cash user. Therefore, the assumptions regarding the cash situation for each of the four fields is essential that the concept works. Following the matrix, each company should have stars that assure the future of the company with their high share and growth. Secondly, cash cows are vital as they provide the money for future investment and cover today's expenses. Moreover, a selected range of question marks is necessary, as they can be turned into stars when funds are added. Dogs are not necessary at all, they are a sign of failure and should be liquidated.
Product Life-Cycle Stages
Besides an actual cash situation of each segment, these can also be linked to a specific product life-cycle stage. Question marks correlate to products in the introduction phase, where costs are high but sales and profits are low. This implies a strategy of investing in order to gain customer attention and increase market share in an overall growing market. If successfully managed, products enter the growth phase and become stars, where profitability begins to rise through economies of scale and a massive increase in sales. However, more and more competitors enter the market which ultimately leads to price decreases and may pushes profits down. In the third stage, the maturity stage, sales volume peaks and especially the company with the biggest relative market share has a huge advantage. Based on the experience curve effect, a company can harvest profits as it has the highest production volumes and is leading the market. Products in this stage are the cash cows. Lastly, the fourth stage is the saturation and decline stage where sales and profits decrease. The market is rather unattractive and products may get phased out. Companys seek for a squeeze out and divestment strategy, such as dogs are treated.
Application in Practice
Although the matrix requires only few data input and is through its illustrative approach relatively easy to understand, there are some elements which need special attention. Also when the tool is applied, it is of vital importance that the right strategic decisions are derived and finally executed. Based on an exemplified case study these will be shown and further discussed.
Constructing the Matrix
Despite the core elements of the matrix are already discussed, special attention has to be given to the scaling of axes and position of the horizontal and vertical line dividing the matrix into its four quadrants. For the vertical axis (growth rate) a continuous scale is used. According to Henderson and Hedley the line separating the vertical axis should be at a growth of 10%[2], as companies tend to use this figure as discount rate in times of low inflation. This means that any growth above 10% is the area where investment becomes especially attractive.[1] However, in some literature it is recommended to set the line equal to the expected inflation adjusted growth in gross national income (GNI).[4] One has to be cautious which scale to use, as it might have serious implications if a business is for example a star, a cash cow, a dog or a question mark. For the horizontal axis (relative market share) a logarithmic scale is used to be consistent with the experience curve effect.[1] It is separated at 1.0, as only the relative market share of the largest competitor can be left of this line and all others are below this value by definition.[2] However, it has to be noted that these guidelines serve only as an approximate guide but turned out to work well in practice.[1] Still, adaptations may have to be made to gain correct results and derive appropriate strategic decisions for the business portfolio. After building up the matrix with its four quadrants each SBU or product can be plotted inside depending on its relevance in sales or assets.
Exemplary Use and Strategic Implications
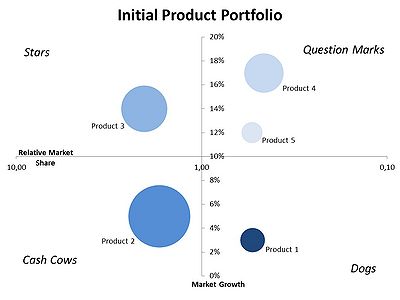
The portfolio in Figure 2 shows exemplary SBUs of a company. The different businesses are assigned to one of the four quadrants and the area of each circle correspondents to the respective volume in total sales. It can be seen that the portfolio is strong in terms of a large cash cow (Product 2) and a promising star (Product 3). Moreover, the company has quite a few question marks (Product 4 and 5) but also a dog (Product 1). The key essence is that each business requires different strategy objectives in order to make the most out of its opportunities. Thus, it would be fatal if one overall goal would be defined for all businesses. The strategic implications therefore would be:
- Cash cows: Maintain current profitability.
- Dogs: Expected to generate some profits, but may be squeezed out and divested.
- Stars: Keep (and expand) current market share.
- Question marks: Invest in some to gain market share and sell others for cash.
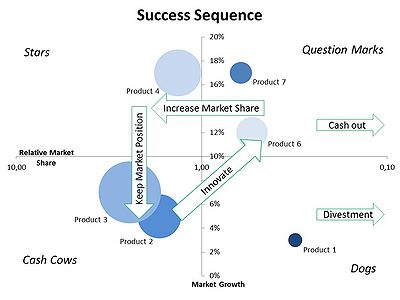
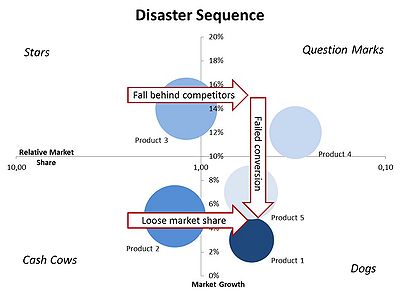
Especially the strategy for the question marks is of extraordinary importance. If the company chooses to invest in all of them, current funds will be not sufficient to develop them towards stars and further on to cash cows. Finally, the company would have a large amount of dogs in their portfolio that failed to gain market share and suck the company’s cash without providing any net return. Henderson described this as the sequence of disaster (see Figure 4).[3] Instead, the company should choose to invest in only a few promising question marks and cash out the remaining ones on time. This will lead to a success sequence[3] in which question marks provide the future net cash flow. Figures 3 (Success Sequence) and 4 (Disaster Sequence) show how the company could have developed from a three years’ perspective. The results can be described as followed:
- Success Sequence: In the success sequence the company took the right decisions for managing the business portfolio. Product 2 (cash cow) provided sufficient funds to develop Product 3 (former star) towards a strong market leader. Although the market is slowing down, Product 3 takes advantage of its strong market position and emerged towards a cash cow. It even contributes more to the total sales than Product 2 now. In terms of the question marks, the company followed two approaches. Product 5 was promising but it required huge investment, so it was decided to sell it for a good share. It is no longer part of the business portfolio. Instead, Product 4 was developed with large amounts of cash towards the new star of the company. Although market growth slowed a bit down, it could significantly increase its market share. Through the cash out of Product 5 and the positive cash flow from the cash cows, the company even had enough funds to innovate and develop the new question marks, Products 6 and 7. Unfortunately, it was not possible to sell Product 1 (dog), so it was decided to cut investment down. This will lead to a slow death without compromising future success of the company.
- Disaster Sequence: Instead of developing and applying a customized strategy for each product, the company decided to distribute investments equally among the different products. According to the model, this leads ultimately into a disaster sequence. Although Product 2 is still the leading in its market, it suffered under poor management and lost some of its market share. Thus, it provided less net return to the company. Even worse the situation is for Product 3 (star). Competitors were more aggressive and gained market share. If no immediate action is taken, it will fall behind further and end up as a dog. This is what happened to Product 4 and 5 (former question marks). Management was not able to commit itself towards a clear strategy in which products to invest. So funds were shared among them, which resulted in a failed conversion towards a star for both of them. Even worse, they required so much cash that research and development expenses were cut down and no new products are in the pipeline. Even Product 1 (dog) received some investment, however it still requires more cash than it contributes. In the future it cannot be expected that the market growth will increase, but the current leader will rather take advantage of its strong position.
This case study provides a good example in how to use the matrix right and which decisions should be taken in order to lead the company’s business portfolio in a success sequence and make the most out of its opportunities.
Relevance in Industry
According to BCG it was estimated, that between the end 1970s and early 1980s the BCG Matrix was used by around half of the Fortune 500 companies.[5] At this time the matrix was at the peak of its success and well known in industry and education. It can be seen as the most successful and well known portfolio management tool.[3] Today, BCG describes the growth share matrix as a classic tool that remains relevant for companies to drive the strategic experimentation required for success in unpredictable markets.[5] The success of the matrix was lifted by different reasons, which can be described as followed:[3]
- At the time research (PIMS study) showed a correlation between market share and profitability which supported the assumptions of the matrix.
- The matrix has an intuitive appeal, is highly figurative and does not require an extensive manual.
- Strategy and portfolio planning was simplified, as alternatives, such as NPV or risk analysis, were difficult to carry out and called for extensive data input.
- The strong bonds between BCG and industry. So was the director of Mead Paper, where the first successful study was carried out, also chairman of BCG’s parent company.
- The successful praise of the tool by BCG and the debate in business and academia increased its publicity and level of application even further.
However, academic evaluation of the matrix and criticism lead towards a decrease in application. As an example Kotler and Keller decided to delete the BCG Matrix (and other Portfolio Management Tools) in their 12th Edition from their popular Marketing Management book.[4]
Limitations and Critical Reflection
Due to its popularity, the BCG Matrix was subject of extensive research and empirical studies to investigate its usefulness. The following quote of Bruce D. Henderson shows how he changed his opinion about the matrix and sees it after time more as:[3]
a milestone on the search for insight into business system dynamics, but certainly not the end of the road.
In research, the matrix was criticized for both: its underlying assumptions and its results when applied in practice. All of the matrix six core elements with their assumptions received some criticism,[3][4] as they were believed to be too simplified or even misleading. In the following these will be examined:
- Classification of Businesses into four Portfolio Categories: Although the classification in four categories creates simplicity, it also leads towards a black-white thinking without an area in between. It may be unattractive for a manager to lead a product that is classified as a dog and by modifying the axis, results can differ widely.
- Strategic Business Units and Product Markets: A core assumption of the matrix is that SBUs can be seen independently from each other. This neglects synergies between the products, as a cash cow may profit from a dog. Furthermore, these synergies are often seen as a reason to bundle different products within a company’s business portfolio.
- Relative Market Share and Cash Generation: Measuring a company’s profitability through its relative market share solely focuses on a strategy of overall cost leadership and neglects other strategies such as differentiation or focus. However, these might be more profitable. Even BCG admits that nowadays market share is no longer a strong predictor of performance.[5]
- Market Growth and Cash Use: Inside the matrix market growth is the only indicator for the attractiveness of a market. This might be not always the case, as other indicators such as competitiveness, regulation or innovation are not considered. In a case study about the airline industry the author concludes Growth tells little about attractiveness.[6] The airline market is known for its strong growth over decades but also for its low profitability and high competition.
- Balance of Cash Flows: Inside the matrix each quadrant is a positive or negative cash flow assigned. However, case studies showed that actual cash flow patterns can deviate from those supposed by the BCG.[6] The assumption that the market leader in a slowly growing market (cash cow) always has the highest profitability and is generating a net cash flow can therefore not hold.[4] Furthermore, the matrix implies to reach a balance of cash flows but this excludes the possibility of external investment. In the matrix funds are only generated inside the company.
- Product Life-Cycle Stages: The link of the four quadrants is criticized as opportunistic, as BCG only tried to implement a popular theory (product life-cycle stages) at the time into their matrix.[3] Life-cycle stages can vary in their length and the proposed strategies by BCG may even harm current businesses. Studies have shown that at least the proposed strategies for dogs often failed to be successful.[4]
Taking into account the deficits one should be aware of the limitations this tool has. So far there is no empirical study that supports the usage of the BCG Matrix,[4] yet it is still applied in industry. But instead of banning it from the syllabus, the matrix limitations should be shown to prevent its misuse and application at all. Ultimately, the BCG Matrix success can be seen as a case history in successful innovation and diffusion of a particular analytical framework.[3]
Annotated bibliography
- ↑ 1.0 1.1 1.2 1.3 1.4 1.5 Hedley, Barry (1977). Strategy and the "Business Portfolio", p. 9-15. Annotation: Hedley, a director of BCG at the time, describes the importance of portfolio management and how the growth share matrix can be used to increase a company's performance.
- ↑ 2.0 2.1 2.2 2.3 2.4 Henderson, Bruce D. (1970). The Experience Curve - Reviewed IV. The Growth Share Matrix or The Product Portfolio. Annotation: In this article Henderson describes the initial concept of the growth share matrix and outlines the basic underlying assumptions. However, Henderson and employees of BCG developed the matrix further with minor adaptations until 1973.
- ↑ 3.0 3.1 3.2 3.3 3.4 3.5 3.6 3.7 3.8 3.9 Morrison, Alan and Wensley, Robin (1991). Boxing up or Boxed in?: A Short History of the Boston Consulting Group Share/Growth Matrix. Journal of Marketing Management, 7, p. 105-129. Annotation: Besides describing the history of the BCG Matrix, the authors also explain the core elements, its application in US industry since the 1970s and evaluate academic criticism. The paper can be seen as one of the most comprehensive works about the tool.
- ↑ 4.0 4.1 4.2 4.3 4.4 4.5 4.6 Drews, Hanno (2008). Farewell to the Growth Share matrix after more than 35 years of usage? A Critical examination of the BCG Matrix. Zeitschrift für Planung & Unternehmenssteuerung, 19, p. 39-57. Annotation: Drews gives a short overview of the BCG Matrix and examines empirical research about the matrix. Based on academic papers and a self-conducted case study on the German airline Lufthansa, he concludes that due to its limitations the BCG Matrix should not be applied.
- ↑ 5.0 5.1 5.2 Reeves, Martin et al. (2014). perspectives – BCG Classics Revisited – The Growth Share Matrix. Annotation: In this article Reeves, a senior partner and managing director of BCG, takes a look back on the matrix and presents also some critical evaluation. However, it is concluded that the tool is still relevant today if adaptions for measuring competitiveness are made.
- ↑ 6.0 6.1 Thomas, Mike and Lange, Peter (1997). A Portfolio Management Approach to Strategic Airline Planning. Europäischer Verlag der Wissenschaften, Bern. Annotation: The authors analyze different strategic portfolio tools, such as the BCG Matrix, and apply these in the airline industry. For the BCG Matrix the authors identify several weaknesses and its non-applicability for the airline industry.


