Gantt Chart
A Gantt chart is a commonly used tool within project management, which, briefly, shows the progress of an on-going project. It is usually made as a bar chart and it relies upon the work breakdown structure, which is a method within project management as well. The history of the Gantt chart goes all the way back to the 1890s where the first version of it was invented by a polish engineer called Karol Adamiecki. The purpose of it was to be a methodology for work harmonization, which was based on graphical analysis. His contribution to the project management tools is known by the name harmonygraph. [1] Around 15 years after the American engineer and management consultant, Henry Gantt, developed a new and improved version of it, which is the one that today is known as the Gantt chart. [2]
Contents |
Use and application of the Gantt chart
Use
The chart shows the tasks that need to be done in a project, when each task needs to be performed, and how long time they are going to take according to the plan. So basically it is a timeline for the project, which manageable illustrates the start and end dates for tasks and events, and how they relate to each other. It is up to the project manager to decide how detailed the chart should be – For instance it could also contain information about who is doing which task.
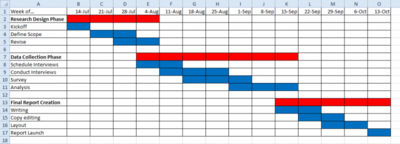
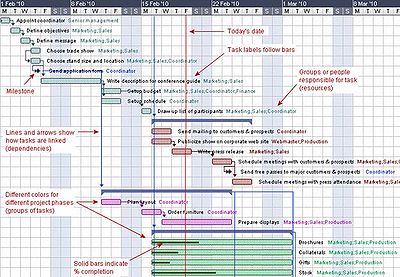
Figure 1 is giving an example of how a simple version of a Gantt chart could be constructed. Here only the duration of the different phases of a project is shown, and then the duration of the tasks which needs to be performed during each of the phases, and in which order. In Figure 2 a larger and a bit more complex Gantt chart is shown. This one contains a lot more information than the chart in Figure 1. For instance is it added who is responsible for which task, which tasks is connected with other tasks and the milestones for the project.
Application
A Gantt charts is applicable in practically every kind of event or project, where tasks need to be planned and organized relatively to each other. An example where it is used can for instance be in the planning of a building process. In such a process a lot of things like ordering materials, hiring workers and planning when and in which order every thing needs to happen, a Gantt chart is a very useful tool because it gives a good and manageable overview.
Limitations
However, the Gantt chart does also have its limitations, and will in some cases not be the most effective tool. One of its disadvantages is that it is based on the work breakdown structure. This means that if the work breakdown structure isn’t constructed, the Gantt chart cannot be made.
Bibliography
- ↑ [http://www.mosaicprojects.com.au/PDF_Papers/P042_History%20of%20Scheduing.pdf ] A brief history of scheduling
- ↑ [http://www.idealware.org/blog/tools-gantt-charts]Tools for Gantt Charts

