Location Based Scheduling
(→Flow-Line Diagram) |
(→Flow-Line Diagram) |
||
| Line 79: | Line 79: | ||
'''Optimization using flow-line diagram''' | '''Optimization using flow-line diagram''' | ||
| − | When the different locations are identified and the internal hierarchy established, then the activities can be plotted. | + | When the different locations are identified and the internal hierarchy established, then the activities can be plotted. The optimization is generated through resources and activity-links. The activity-links helps reducing the length of the project, as the graphical representation in the Flow-Line Diagram secures that multiply activities can be scheduled simultaneous. This without causing an accumulation of resources at a certain location. Other traditional scheduling methods and tools do not ensure this visual overview when the processes "squeeze together". |
| + | |||
| + | '''Location-Based activity-linkages''' | ||
| + | LBS | ||
| + | |||
| + | '''Control of resources and linkages''' | ||
'''Fig x,x1,x2''' illustrates a common situation. Three different activities should be carried out, in this example on the same hierarchical level (stairway level). Activity 1 has to be finished in a specific location before Activity 2 can begin. Activity 2 has to be finished in a specific location before activity 3 can begin, and so on. | '''Fig x,x1,x2''' illustrates a common situation. Three different activities should be carried out, in this example on the same hierarchical level (stairway level). Activity 1 has to be finished in a specific location before Activity 2 can begin. Activity 2 has to be finished in a specific location before activity 3 can begin, and so on. | ||
Revision as of 16:05, 20 September 2015
5.1 Article Type 1: Explanation and Illustration of a Method
[The articles are expected to adhere to the following structure:]
- Big idea: describe the tool, concept or theory and explain its purpose. The section should reflect the current state of the art on the topic
- Application: provide guidance on how to use the tool, concept or theory and when it is applicable
- Limitations: critically reflect on the tool/concept/theory. When possible, substantiate your claims with literature
- Annotated bibliography: Provide key references (3-10), where a reader can find additional information on the subject. Summarize and outline the relevance of each reference to the topic.
(around 100 words per reference). The bibliography is not counted in the suggested 3000 word target length of the article.
The Location Based Scheduling (LBS) method is developed to help the construction industry with workflows and planning. The most common method in time and resource planning in construction is still today Critical Path Method (CPM). CPM has been the most dominating method since it was introduced in the late 1950. It has been proved an effective method for time and resource planning of projects. Thus, some critics have been raised about the CPM-method in relation to construction projects, as it is not sufficiently supporting construction management during execution and not to create a continuous and thus economical flow of resources. The LBS method is developed for the planning and management of workflows and could therefore be expected to be a viable alternative to CPM. The construction industry struggles with the subsequent delays and budget overruns and hopefully the LBS can help the industry to meet these challenges. The main philosophy about LBS is to create a tact in the construction projects. The different tasks in the projects need to go along in the same flow to create a constant progression without wasting time.
The Location Based Scheduling (LBS) method is visualized by a graphical tool based on a technique developed by Karol Adamiecki in the early 20th century. [1] Karol Adamiecki developed a schedule tool named harmonogram. This tool includes the location as a key element in the scheduling, in contrast to the Gantt Chart. There has been historical examples of the application of Adamiecki's concept. The construction work of The Empire State Building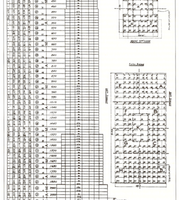
Contents |
About Location Based Scheduling
- Big idea: describe the tool, concept or theory and explain its purpose. The section should reflect the current state of the art on the topic

Location Based Scheduling is placed in the realm of Project Management. The main focus of the article is to describe LBS, a Project Time Managements tool, used by project managers in the construction industry. As shown in fig. PMWheel from Project Management Body of Knowledge [3], Project Time Management is a crucial part of a project managers scope.
The overall idea in LBS is to create a schedule that can be used as followed: [4]
- The schedule should ensure that the main goal of the project is archived within the time-, resource,- and qualitative framework applicable to the project.
- The schedule works as an overview map of the project, showing the planned way from start to end.
- The schedule serves as a basis for analysis and decisions regarding choice of production methods, materials and supplies and other resources.
- The schedule serves as a communication tool to convey the structure of the production progress: what should be done when - which resources should be used - in which order should the tasks be carried out.
- The schedule serves as an foundation for running following-up on the produced part of the project. Therefore, it can be used as a basis for identifying possible deviations and the consequences of these.
LBS is based on the fundamental planning elements: activities, resources and the link between them. In addition to this, LBS also uses: locations, critical room to manoeuvre, location based activity links and resource flow to name a few. A central part of LBS is to create the right flow through the project. A right flow results that the resources in the independent activities flows smooth through the different locations of the project. A geographical location of the activities in the project is added in LBS. This makes it possible to identify where and when the different tasks should be carried out. Furthermore, it creates the possibility to draw the LBS-methods typical "time/place-diagram" or "Flow-line" diagram, which is the LBS-methods graphical representation. [4]
Flow-Line Method
Professor Shlomo Peer from Technion-Israel Inst. of Tech., Haifa, Israel, was one of the first contributors to the flow-line method. This method constituted a new way of displaying and handling activities in construction projects. One of Shlomo Peer's main points [5] was that scheduling and control in the construction industry should aim to complete the projects in the shortest possible time that is compatible within the financial limitations. The fastest time is not necessarily the most economical, nor is the relationship between available resources and construction time linear. Based on this statement, Shlomo Peer produced a construction planning process for the location-based methodology. The step is as follows:
- Break down the project into constituent component processes.
- Divide realization of these processes between adequate production crews.
- Define technological connections between the crews and activity categories.
- Decide on the flow line that should dictate the progress of the project given financial or resource limitations.
- Estimate the resulting construction time and decide on the number of production units that should be employed in parallel.
- Balance the progress of noncritical flow lines with that of the chosen critical one, aiming to achieve working continuity.
- Within practical limits, check the possibility of shortening construction time by introducing planned breaks in continuity or changes in crew size.
- Analyze the entire process in terms of time and duration of activities and produce a plan.
When the eight steps above is carried out, one can start producing the flow-line diagram.
Flow-Line Diagram
The Flow-Line Diagram is the graphic tool in LBS. The different activities are illustrated as lines in a XY-coordinate system. The Y-axis in the Flow-Line diagram is divided into the physical locations of the project. The X-axis indicates the timewise progress of the project. The activities depicted as lines in the coordinate system. Since there is an axis for time and locations, shows the lines where and when activities has to be carried out. From the flow lines the duration of each activity is seen at each location. The activities can be scheduled in parallel to one another, so there in this manner will be obtained an even flow and a stable rhythm of the construction. This results, that there are no days with many activities and other days with very few activities. A rapid and short activity has a steep line, while a slow and time-consuming activity has a flatter line. In Fig. intro til LBS have activity 1 and 3 a duration of one day, and activity 2 a duration of eight days.
To create the flow-line diagram, the locations of the project has to be decided.
Identifying the locations

Identifying the localities of the project is central element in LBS-method. The projects hierarchical location structure (e.g building - block - stairway - apartment) is shown in the Flow-Line Diagram. Each activity in the schedule is planed in relation to a location. To decide the hierarchical location structure a Location Breakdown Structure (LBS) is performed. This hierarchical breakdown structure can be compared with the Work Breakdown Structure (WBS), used in activity-based scheduling. The logic behind LBS is that the sum of locations on a lover level counterbalances a location on a higher level, as shown in Fig 1. As activities can correspond to different levels of the hierarchy, one needs to make the following considerations when determining the location hierarchy:[4]
- What is the smallest site where repetitions will occur in the project?
- What is the smallest locality in which material resources for current activities can be distributed?
- Which is the largest locality in which there is only room for the execution of the current activity, i.e., which can not take place other activities at the same time?
E.g. preparation of the construction site will in Fig.1 correspond to he building level in the hierarchy, whereas installation of kitchens would correspond to the apartment level in the hierarchy.
Optimization using flow-line diagram When the different locations are identified and the internal hierarchy established, then the activities can be plotted. The optimization is generated through resources and activity-links. The activity-links helps reducing the length of the project, as the graphical representation in the Flow-Line Diagram secures that multiply activities can be scheduled simultaneous. This without causing an accumulation of resources at a certain location. Other traditional scheduling methods and tools do not ensure this visual overview when the processes "squeeze together".
Location-Based activity-linkages LBS
Control of resources and linkages
Fig x,x1,x2 illustrates a common situation. Three different activities should be carried out, in this example on the same hierarchical level (stairway level). Activity 1 has to be finished in a specific location before Activity 2 can begin. Activity 2 has to be finished in a specific location before activity 3 can begin, and so on.
The beginning of a line indicates the start date for the entire task. The intersection between the flowline and horizontal line from the y-axis indicates the start and finish date in the given section. The chosen example illustrates a project with four activities. All the activities have individual production rates. Figure x shows an example where Activity 4 becomes discontinuous because the preceding activity C is slower.

Figure x1 shows a situation where Activity B and C are accelerated to the fastest possible production rate. Thus, this situation might not be the optimal. Activity A is now limiting Activity B and C which become discontinuous.

Finally, Figure x2 shows the desired principle [5], where activities B, C, and D are accomodated to the production rate of activity A.

Theory of the tool
Purpose of the tool
Current state of art
Application
Guidance
When is it applicable?
Limitations
Critically reflects
References
- ↑ Martinez, Natalia Rodriguez (2013) ‘Optimization of Flowline Scheduling vs.Balanced Resources and Task Continuity,
- ↑ Sacks, R. & Partouche, R (2009) ‘Empire State Building Project: Archetype of "Mass Construction", Journal of Construction Engineering and Management, 136(6), 702-710.
- ↑ The Project Management Institute (2008) ‘A Guide to the Project Management Body of Knowledge (PMBOK(R)) Guide,
- ↑ 4.0 4.1 4.2 Andersson, N. & Christensen, K. ‘Location-based Scheduling: "Vurdering af LBS-metodens anvendelse i byggeprojekter",
- ↑ 5.0 5.1 Peer, S ‘Network analysis and construction planning, Journal of the Construction Division-ASCE, 100(NCO3), 203–210.,