-
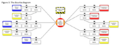
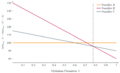
[[File:Diagram.png|thumb|650px|'''Figure 2''': To the right is the share price for GM, Ford an
27 KB (4,416 words) - 19:02, 17 November 2018
-
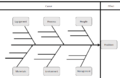
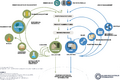
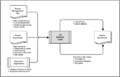
[[File:Cause-and-Effect Diagram.PNG|thumb|Cause-and-Effect Diagram (''adopted from The Standard for Portfolio Management'') <ref name=
...s of causality in relation to possible risks and portfolio objectives e.g. cause-and-effect diagrams, system or process flow charts and influence diagrams. The tools c
27 KB (4,134 words) - 15:20, 16 November 2018
-
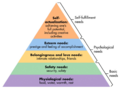
[[File:maslow-diagram.png|400px|thumb|center|Maslow diagram, by https://www.simplypsychology.org/masl
16 KB (2,391 words) - 21:05, 21 February 2021
-
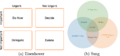
...sion when prioritizing your task or a project group tasks. [[File:The sung Diagram.png|500px|thumb|Figure 3: The Sung Diagram, <ref name="The Sung Diagram: Revita
15 KB (2,559 words) - 19:58, 22 March 2022
-
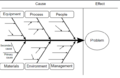
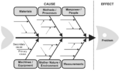
...ay of looking at effects and causes, and can therefore be referred to as a cause-and-effect diagram. It generally represents a model of indicative presentation for the
[[File:A-generic-representation-of-the-Ishikawa-diagram-aka-Fishbone-diagram.png|400px|thumb|centre|Figure 1: Illustration of a Fishbone diagram]]
15 KB (2,501 words) - 18:38, 27 March 2022
-
[[File:Circular economy butterfly diagram.png |500x500px| thumb | '''''Figure 1:''''' Butterfly Diagram developed by Elle
26 KB (3,843 words) - 12:17, 9 May 2023
-
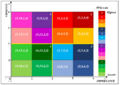
[[File:Diagram.png|400px|thumb|right|'''Figure 4:''' 4x4Eisenhower Matrix&PPQ Scale diagram, (
27 KB (4,039 words) - 17:16, 9 May 2023
-
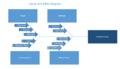
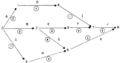
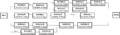
[[File:PERT diagram.png|1050px|thumb|center|'''Figure 4'''. Complete PERT diagram]]
30 KB (4,614 words) - 17:00, 9 May 2023
-
[[File:Sung Diagram.png|600px|thumb|right|Sung Diagram variation of the Eisenhower Matrix]]
22 KB (3,495 words) - 20:32, 9 May 2023


